Configure Elastic Stack Step-by-Step
Normally, you use the load-config script provided by SEAL Systems for configuring Elastic Stack, refer to Configure Elastic Stack.
However, you can also execute the configuration step-by-step via the Kibana user interface as described here.
-
Stop the
seal-filebeatservices on all PLOSSYS 5 servers (if already installed) so that no new messages will be sent to Elasticsearch:plossys service stop seal-filebeat -
Open the Kibana user interface:
http://<admin_server>:5601 -
In order to focus on the index management, collapse some parts of the menu and select
Dock navigation: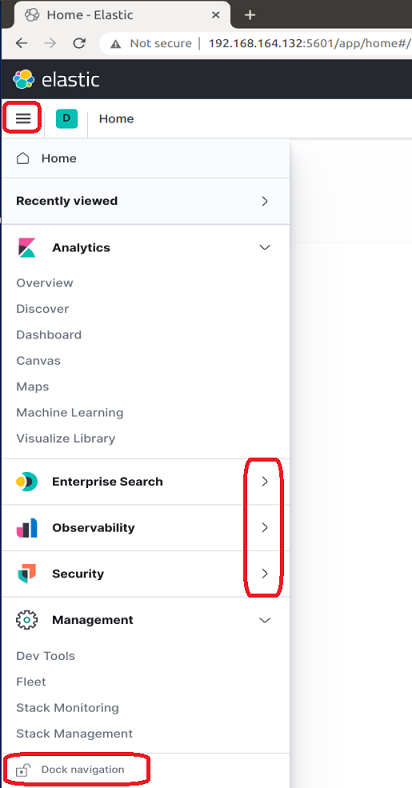
-
Delete the old indices (
seal-plossys-5-log,seal-plossys-5-statistics,seal-plossys-5-audit,seal-easyprima-audit) due to these were created byseal-filebeatby default: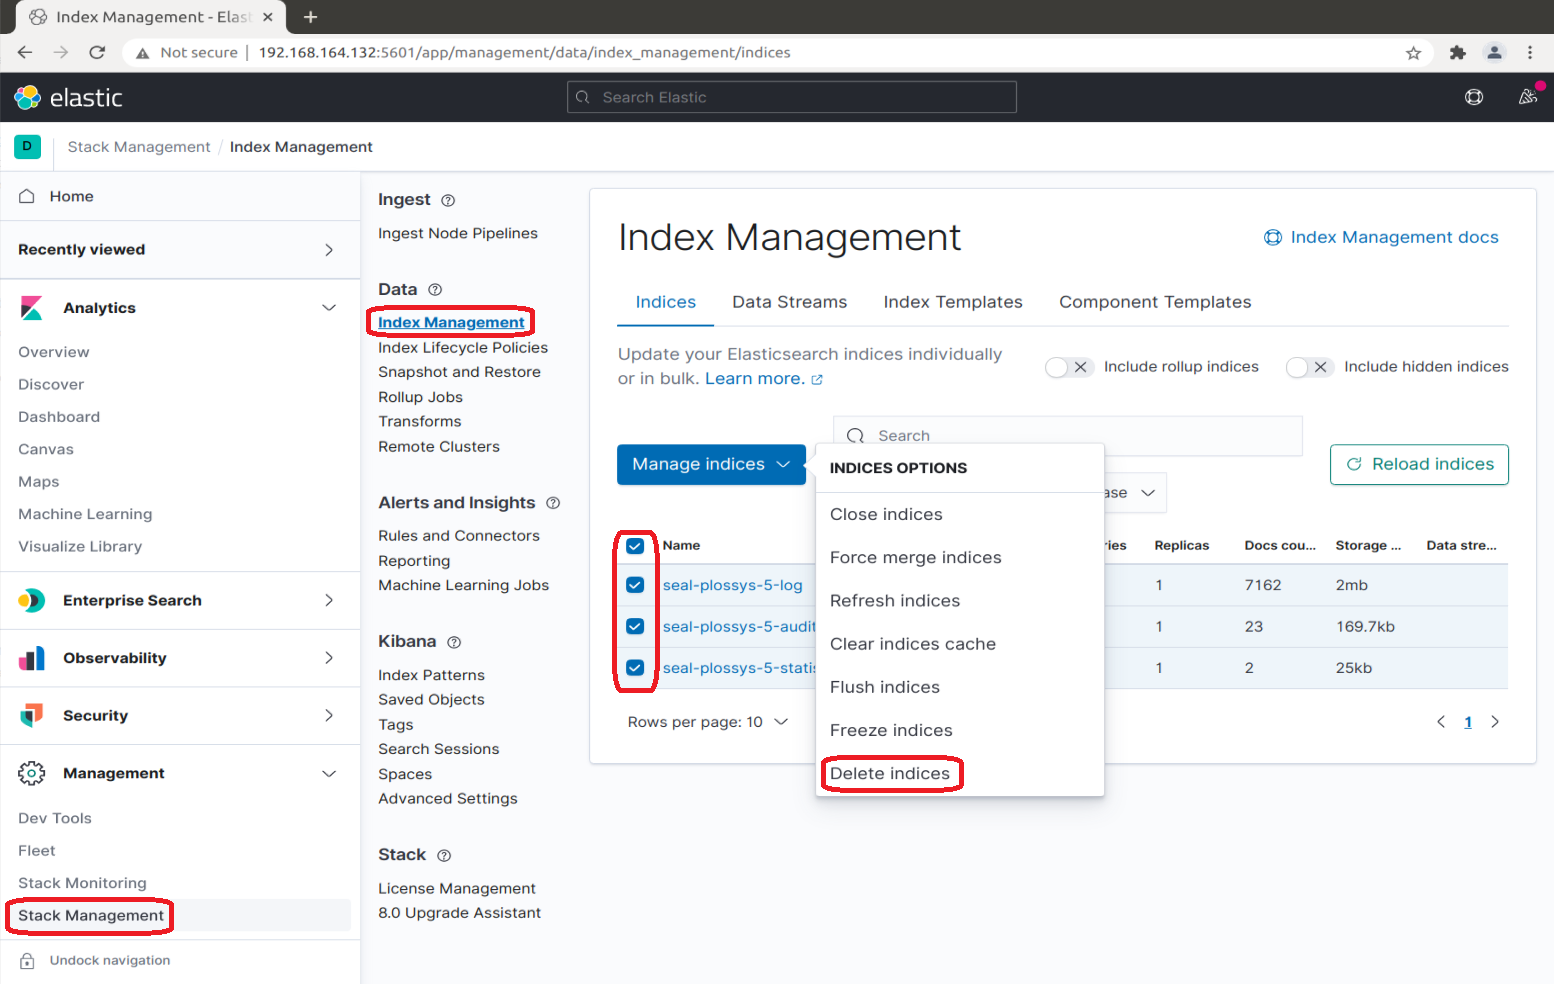
-
Create the index lifecycle policies for the
seal-plossys-5-logindex and specify the following settings. Repeat the steps forseal-plossys-5-statistics,seal-plossys-5-auditandseal-easyprima-auditcorrespondingly if desired: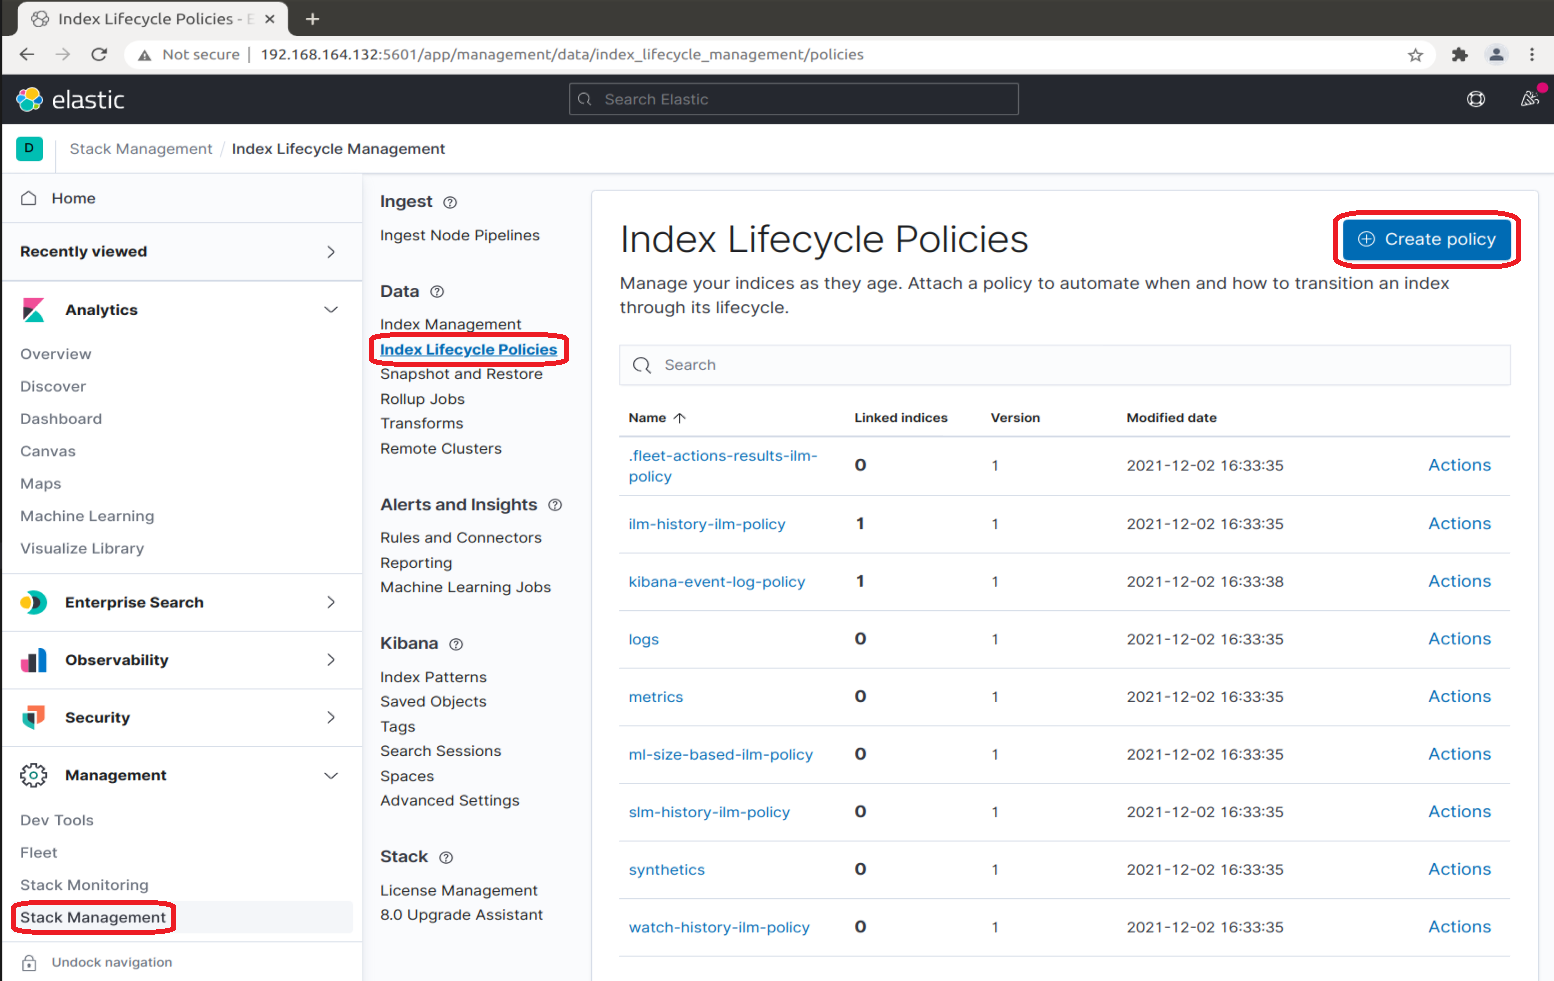
-
In
Policy name, specify the name of the policy. Although the policy name is arbitrary, we recommend using the same name as for the index (seal-plossys-5-log) -
In the
Hot phasesection, expandAdvanced settings, switch offUse recommended defaultsand specifyMaximum primary shard size. We recommend 10 GB.Hint - deprecated
As of SEAL Elastic Stack 7.16.0.53, the previously used setting
Maximum index sizeis deprecated and will be removed in one of the next versions. For more information, refer to Elastic Stack.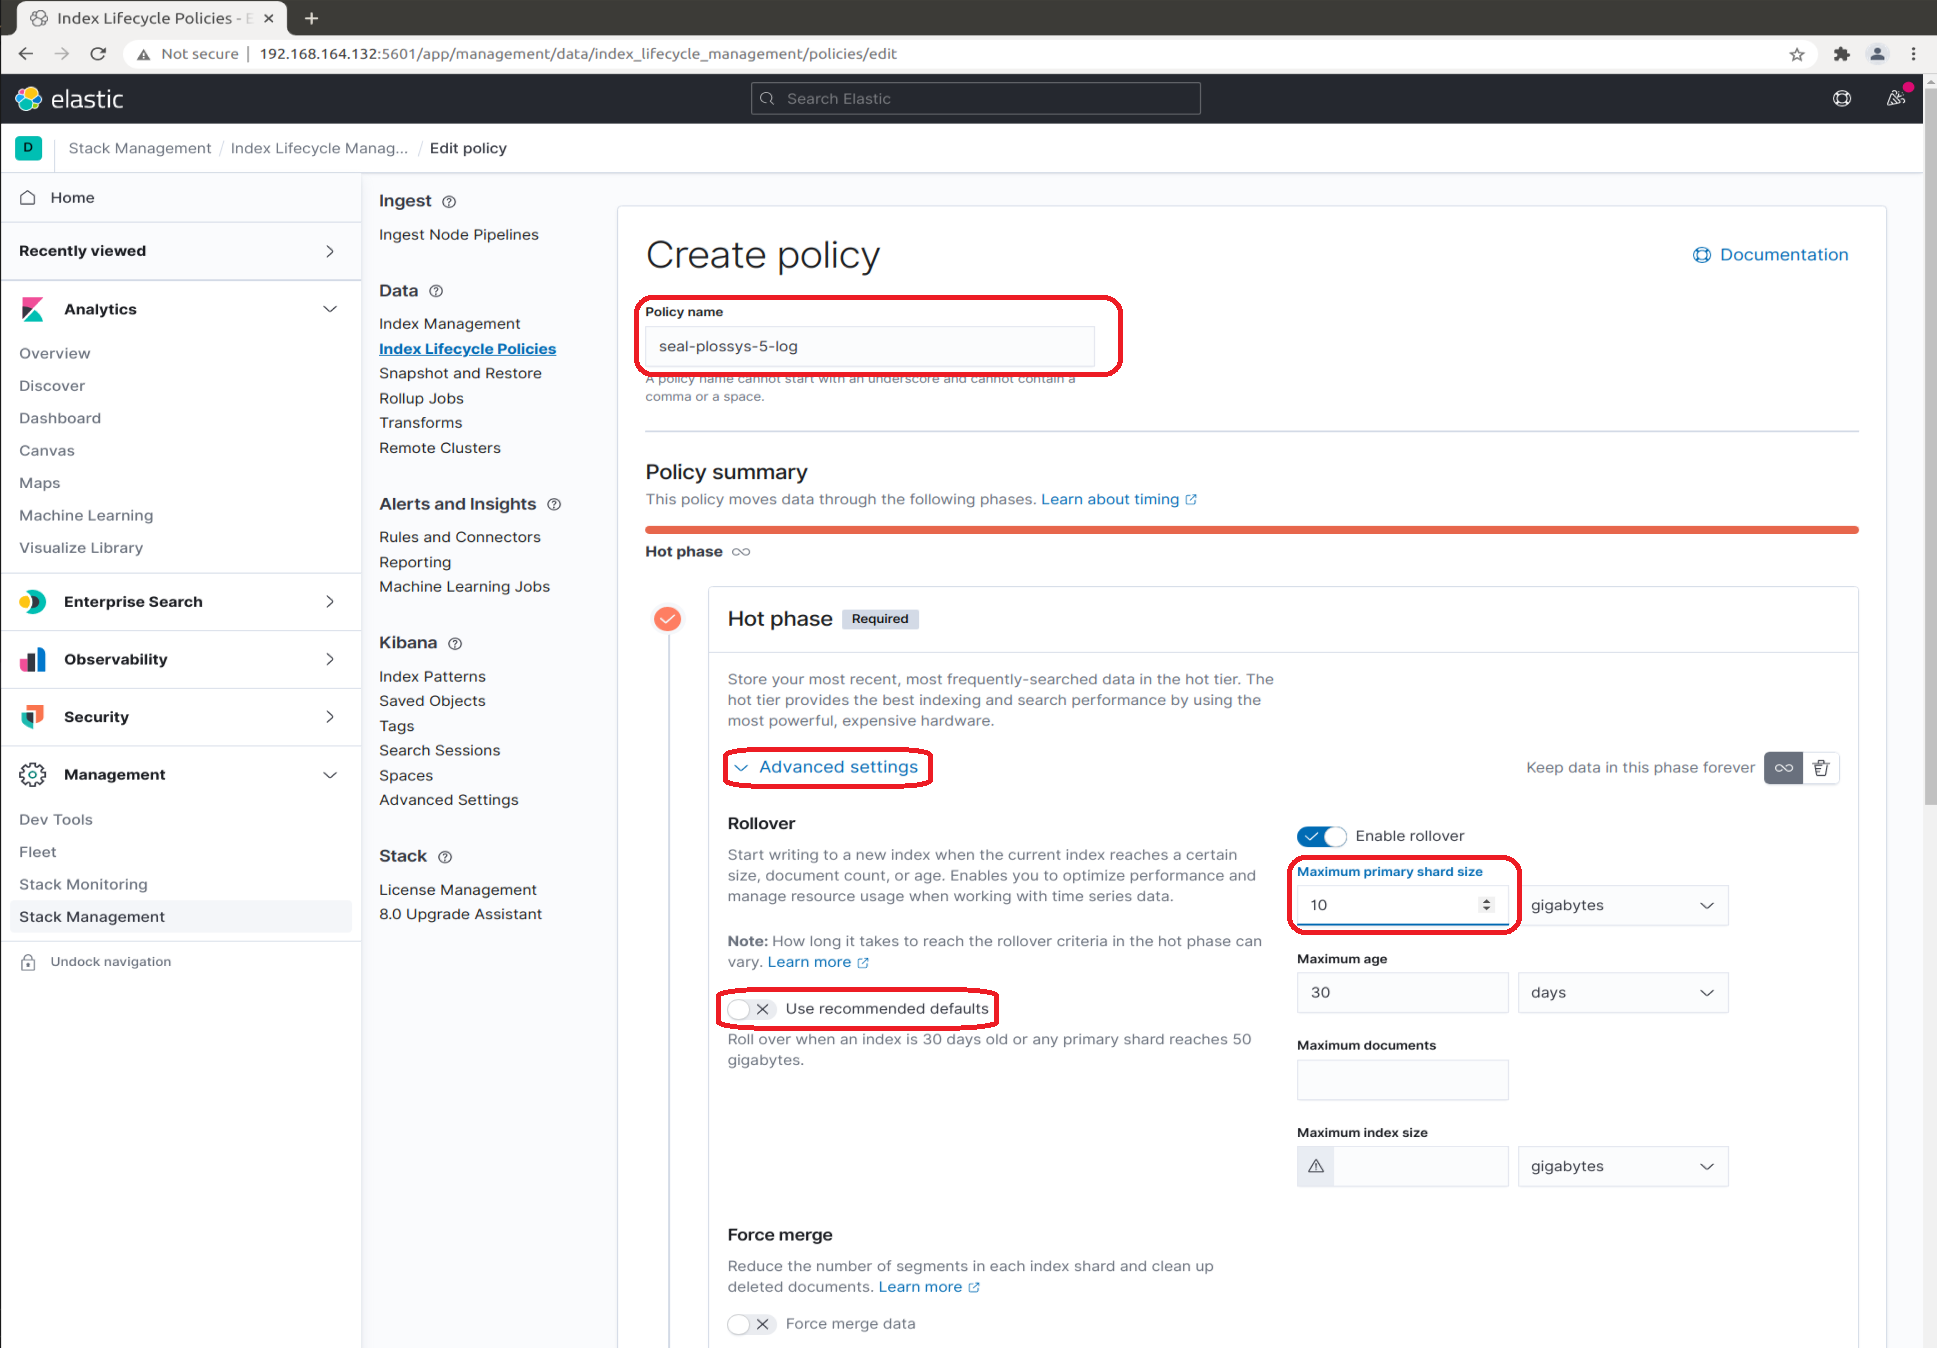
-
Switch on the
Delete phasesection by clicking the trash icon and specify a time inMove data into phase when. We recommend 7 days.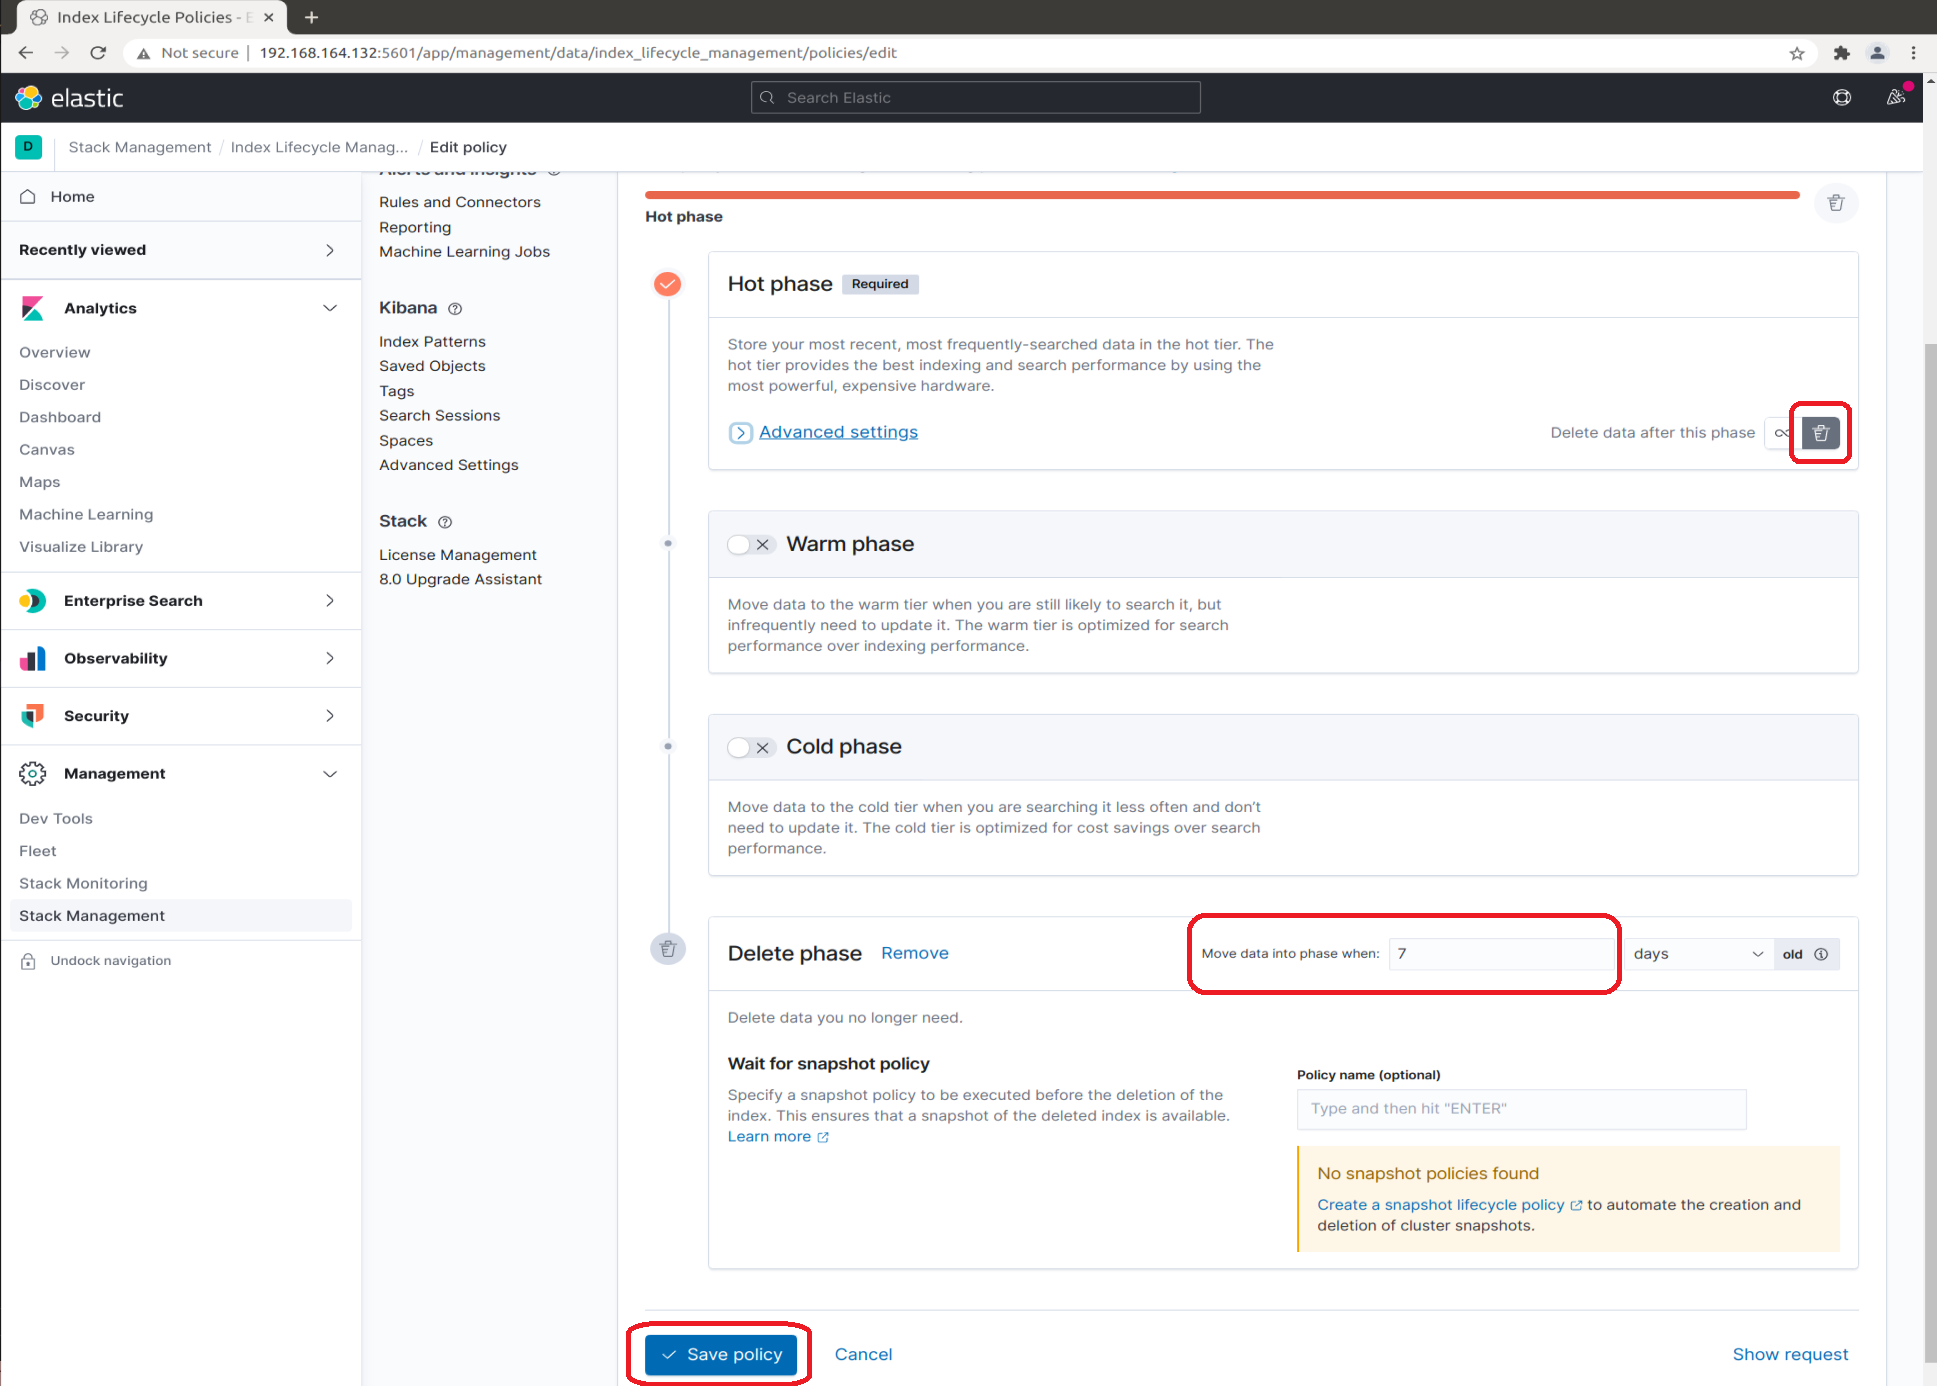
-
-
Create the index template for the
seal-plossys-5-logindex and specify the following settings. Repeat the steps forseal-plossys-5-statistics,seal-plossys-5-auditandseal-easyprima-auditcorrespondingly if desired: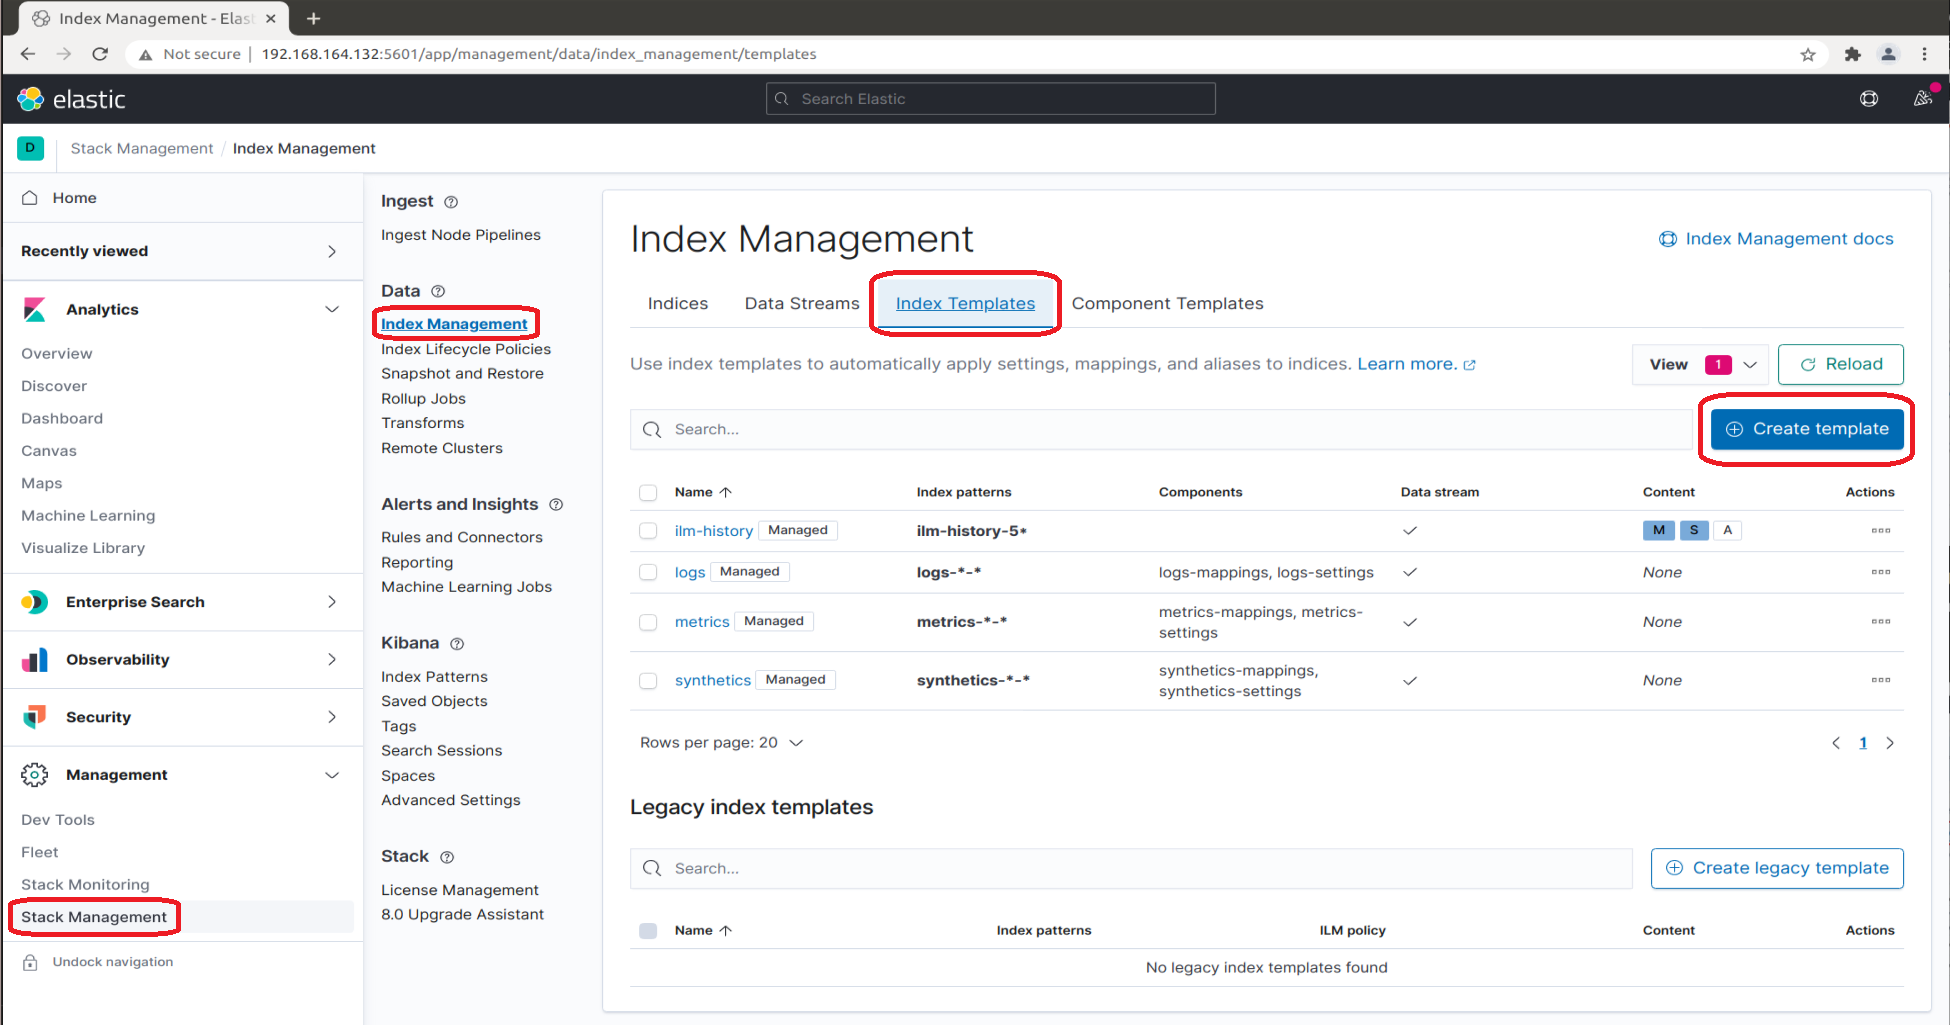
-
In the
Logisticstab, specifyName. We recommend using the same name as for the index (seal-plossys-5-log). -
In
Index patterns, specify the name of the index followed by-*(seal-plossys-5-log-*).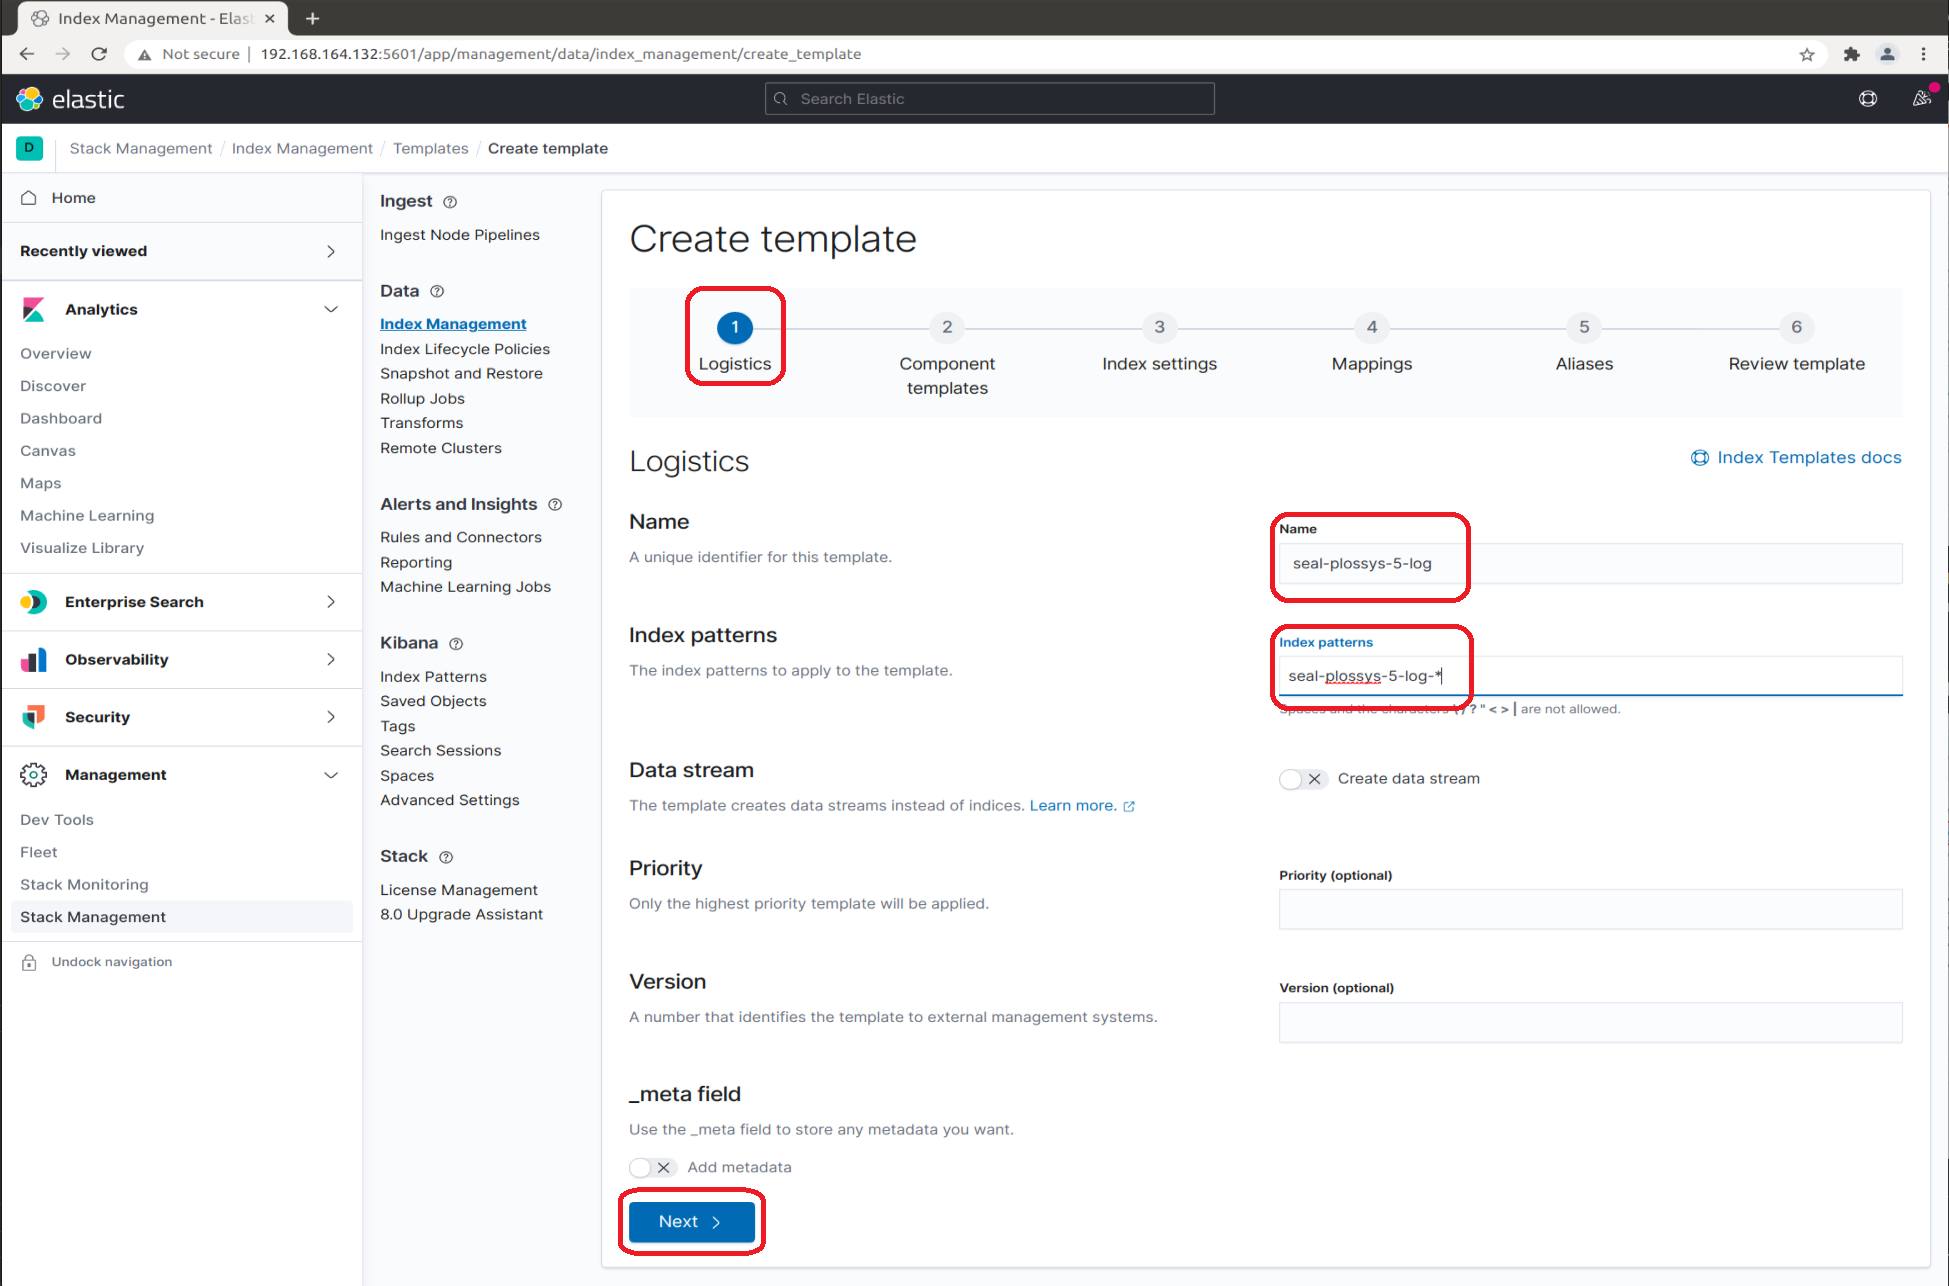
-
In the
Component templatestab, nothing has to be specified: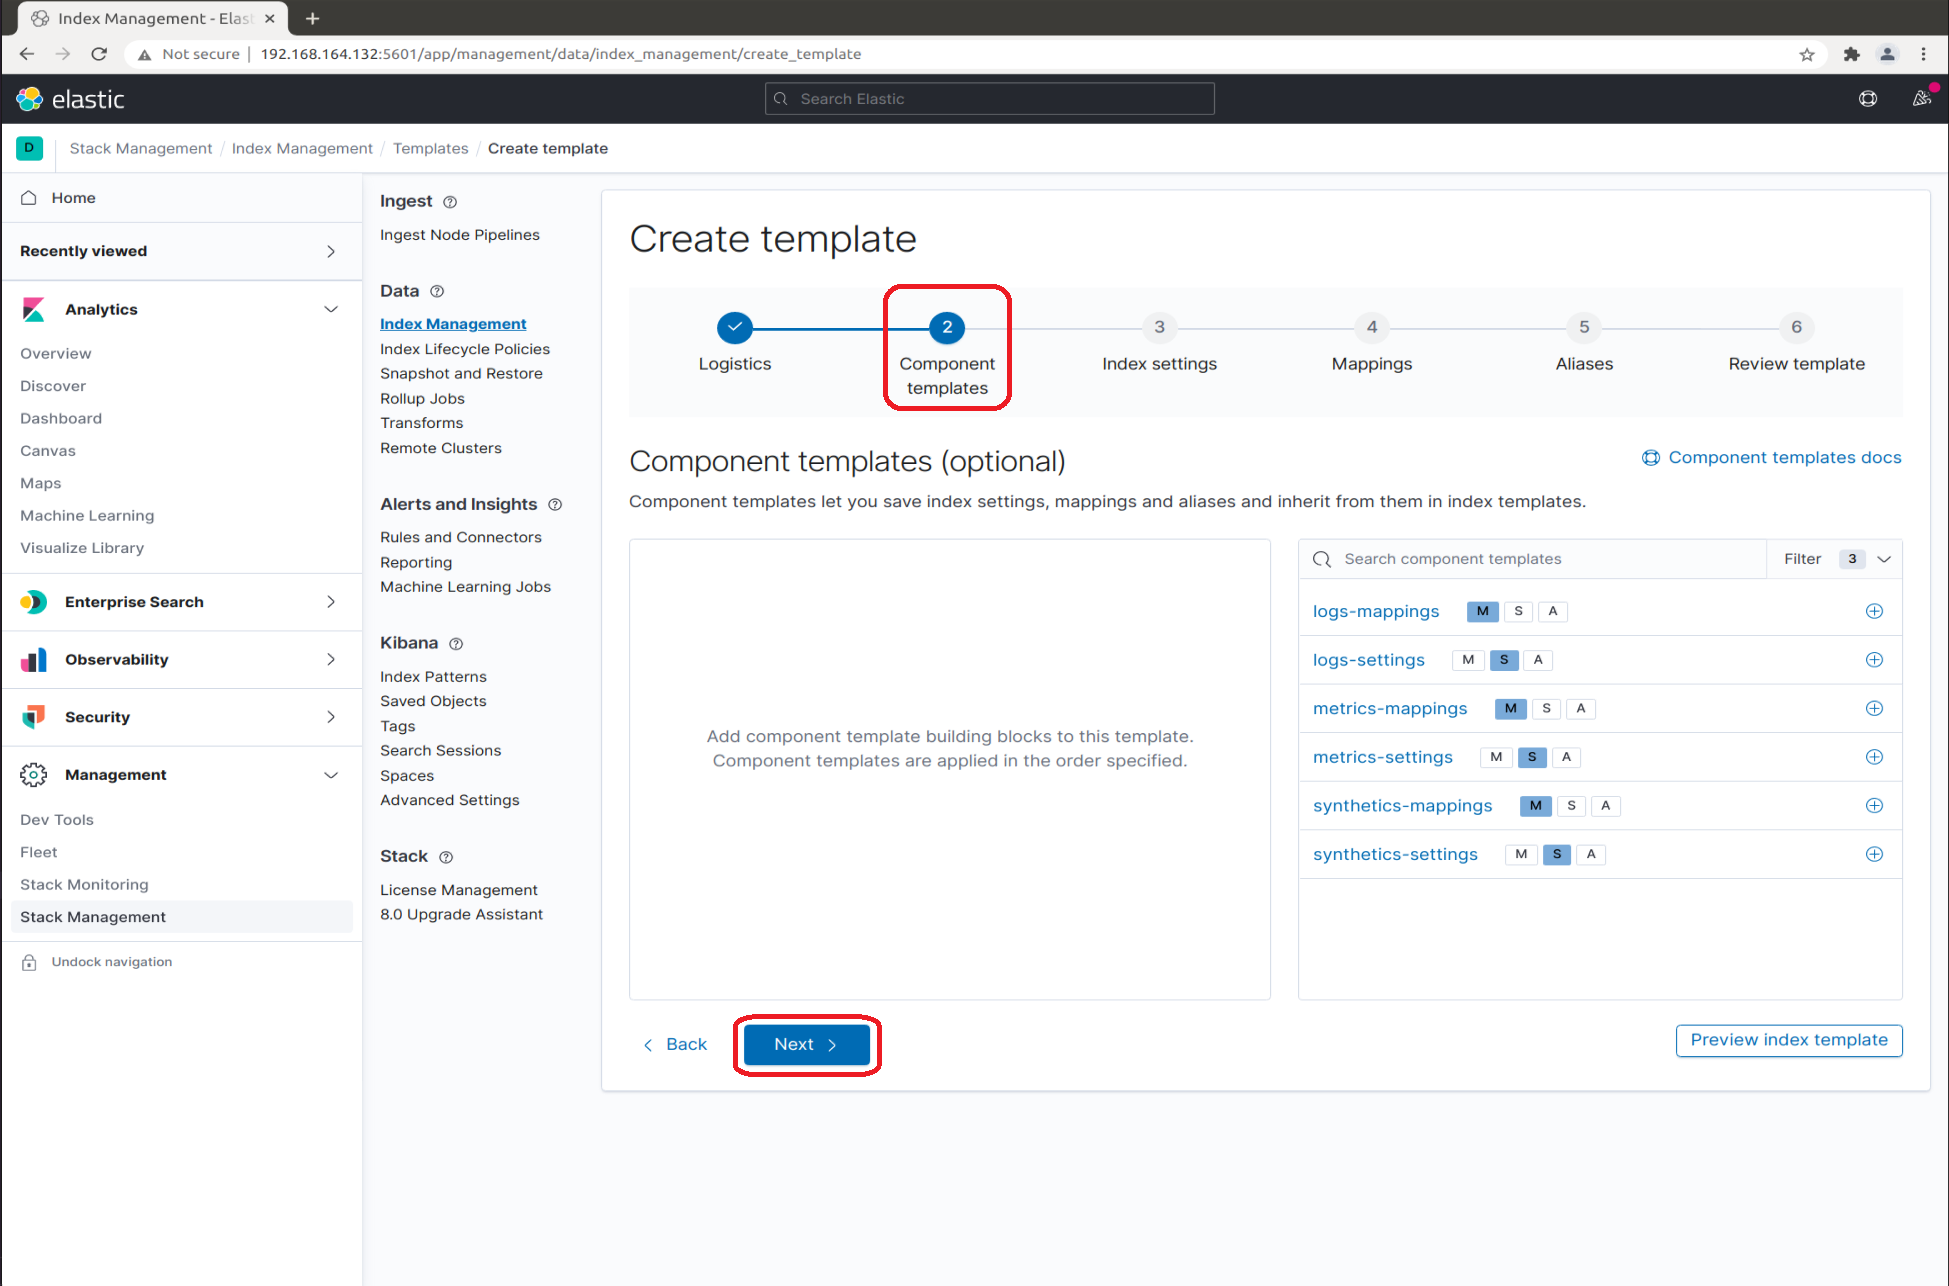
-
In the
Index settingstab, enter the following JSON object. The JSON object given below corresponds to theseal-plossys-5-logindex template. Adjust the JSON object for the other index templates correspondingly:{ "index": { "lifecycle": { "name": "seal-plossys-5-log", "rollover_alias": "seal-plossys-5-log" }, "mapping": { "total_fields": { "limit": "2000" } } } }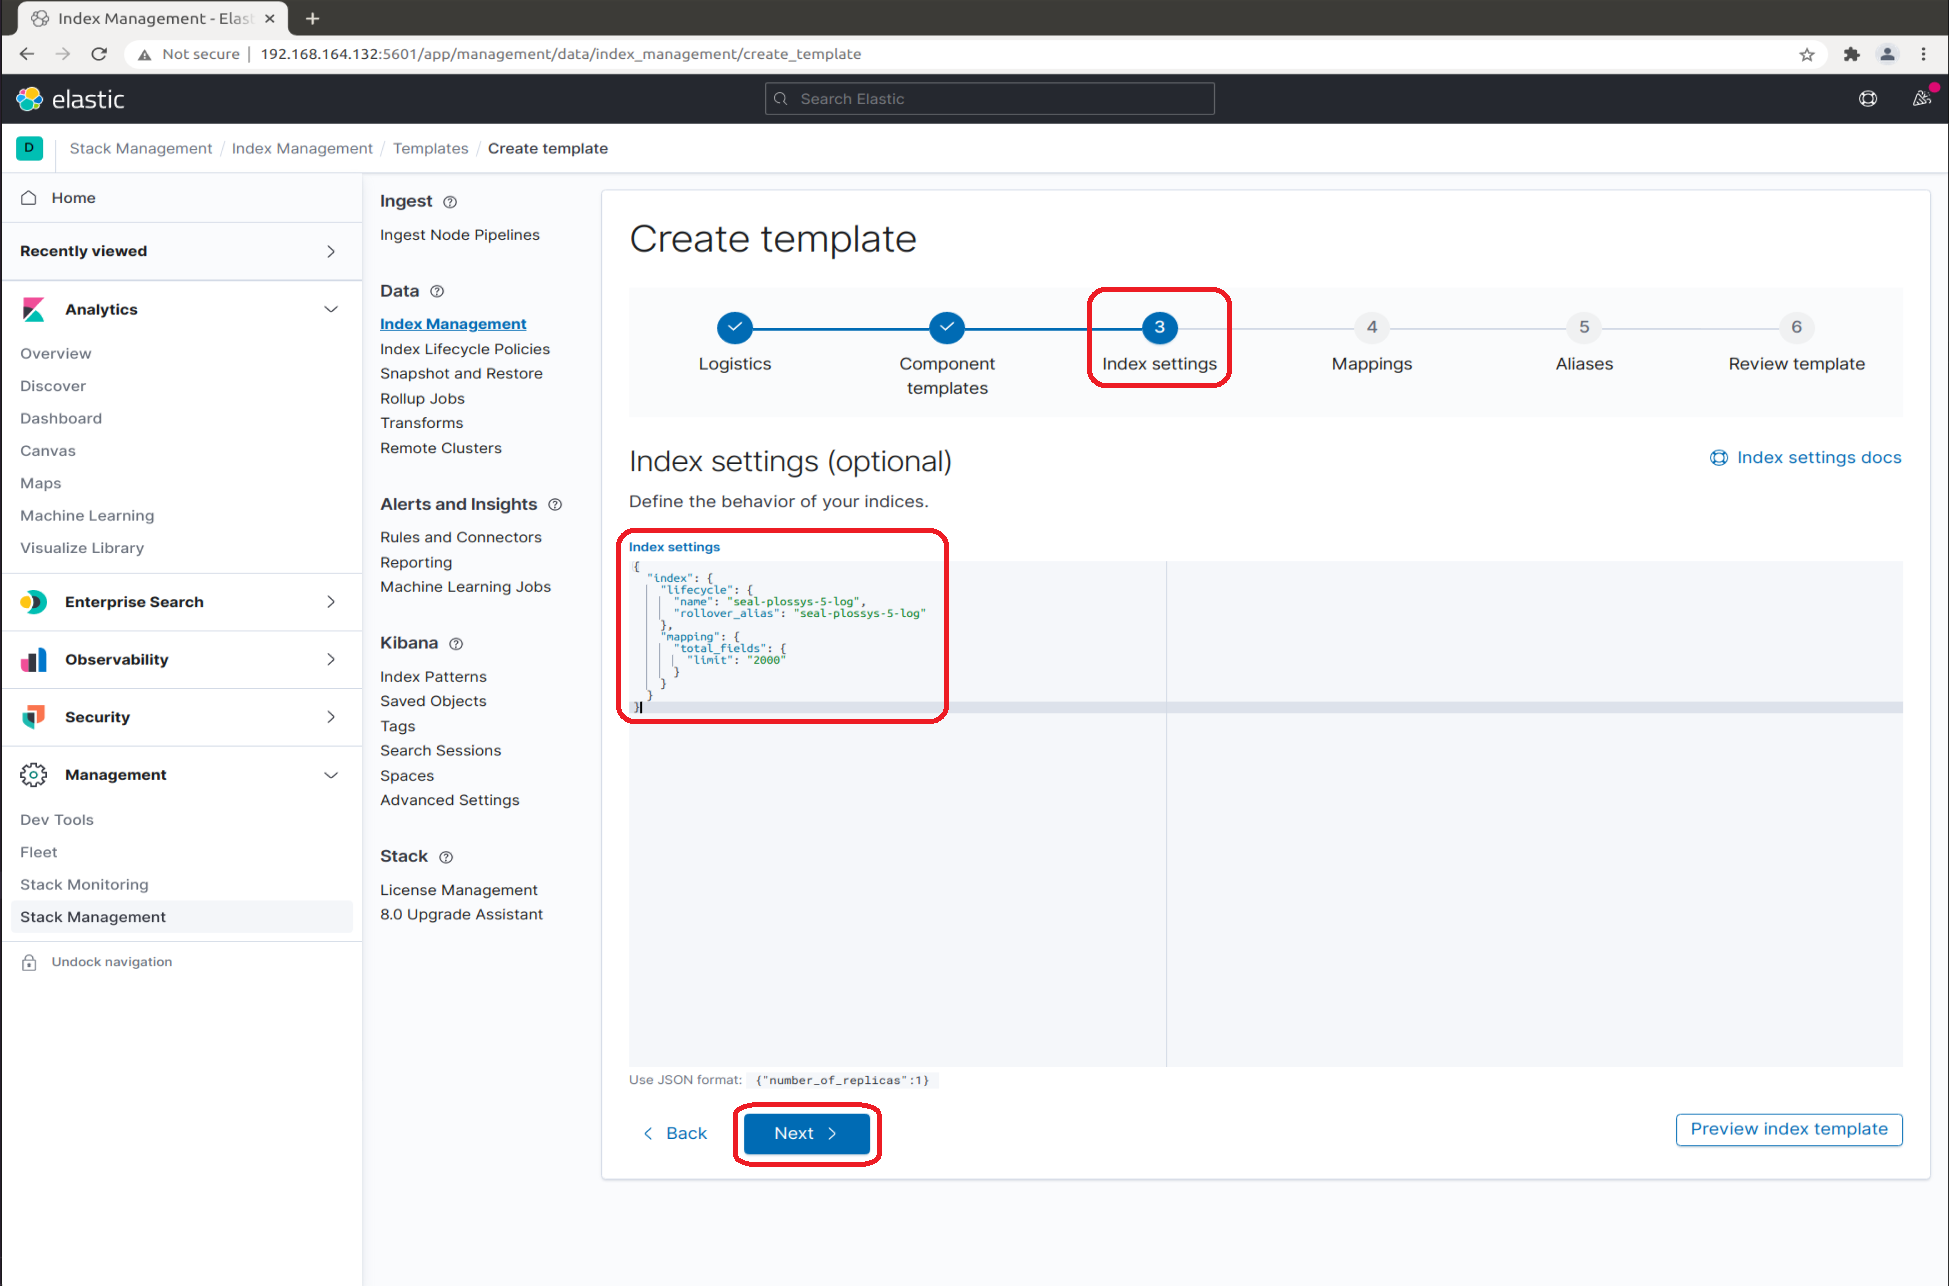
-
In the
Mappingstab, you specify different items depending on the index template currently being configured:-
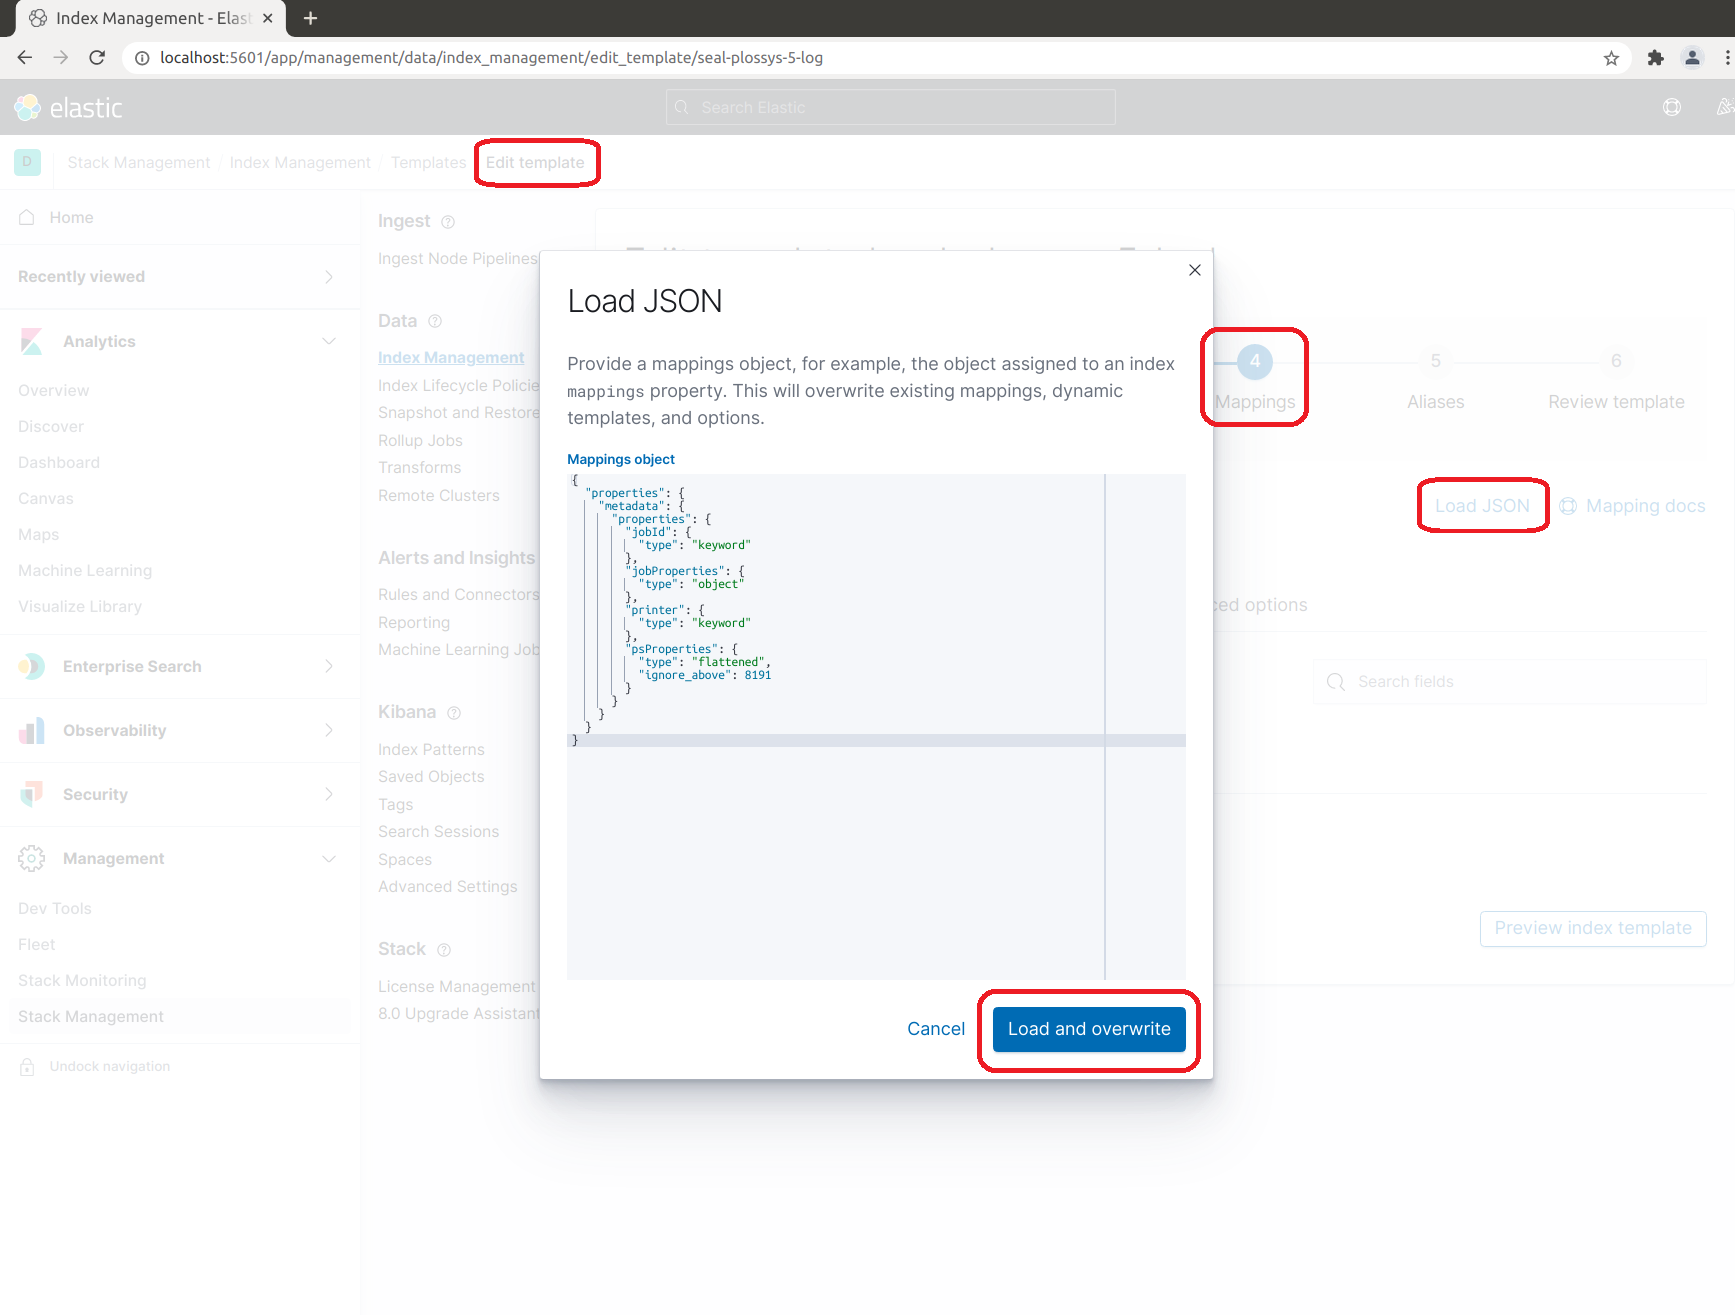
For
seal-plossys-5-log, clickLoad JSONand enter the following JSON object:{ "properties": { "metadata": { "properties": { "jobId": { "type": "keyword" }, "jobProperties": { "type": "object" }, "printer": { "type": "keyword" }, "psProperties": { "type": "flattened", "ignore_above": 8191 } } } } }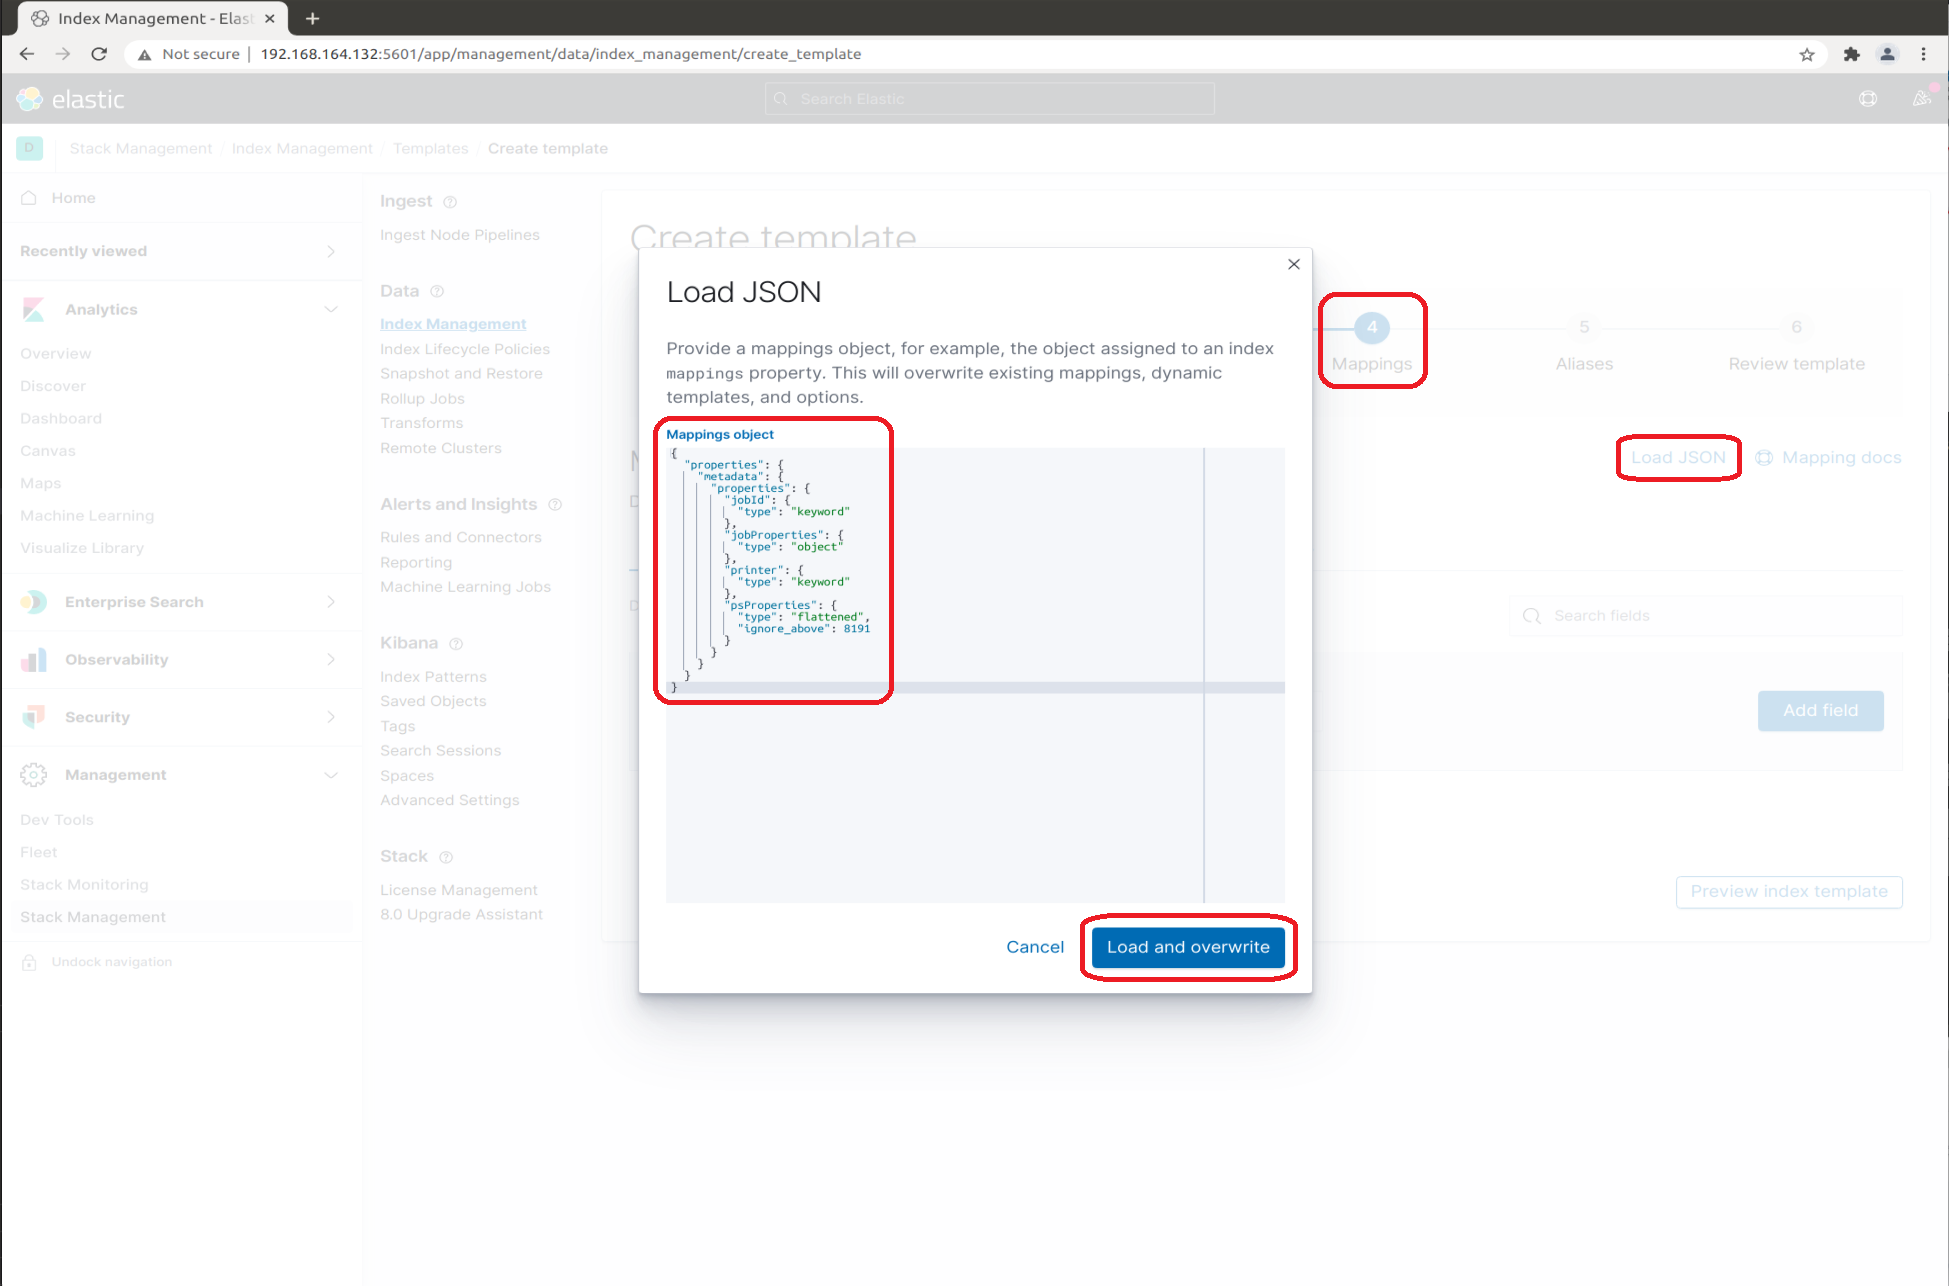
-
For
seal-plossys-5-statisticsandseal-plossys-5-audit, nothing has to be specified: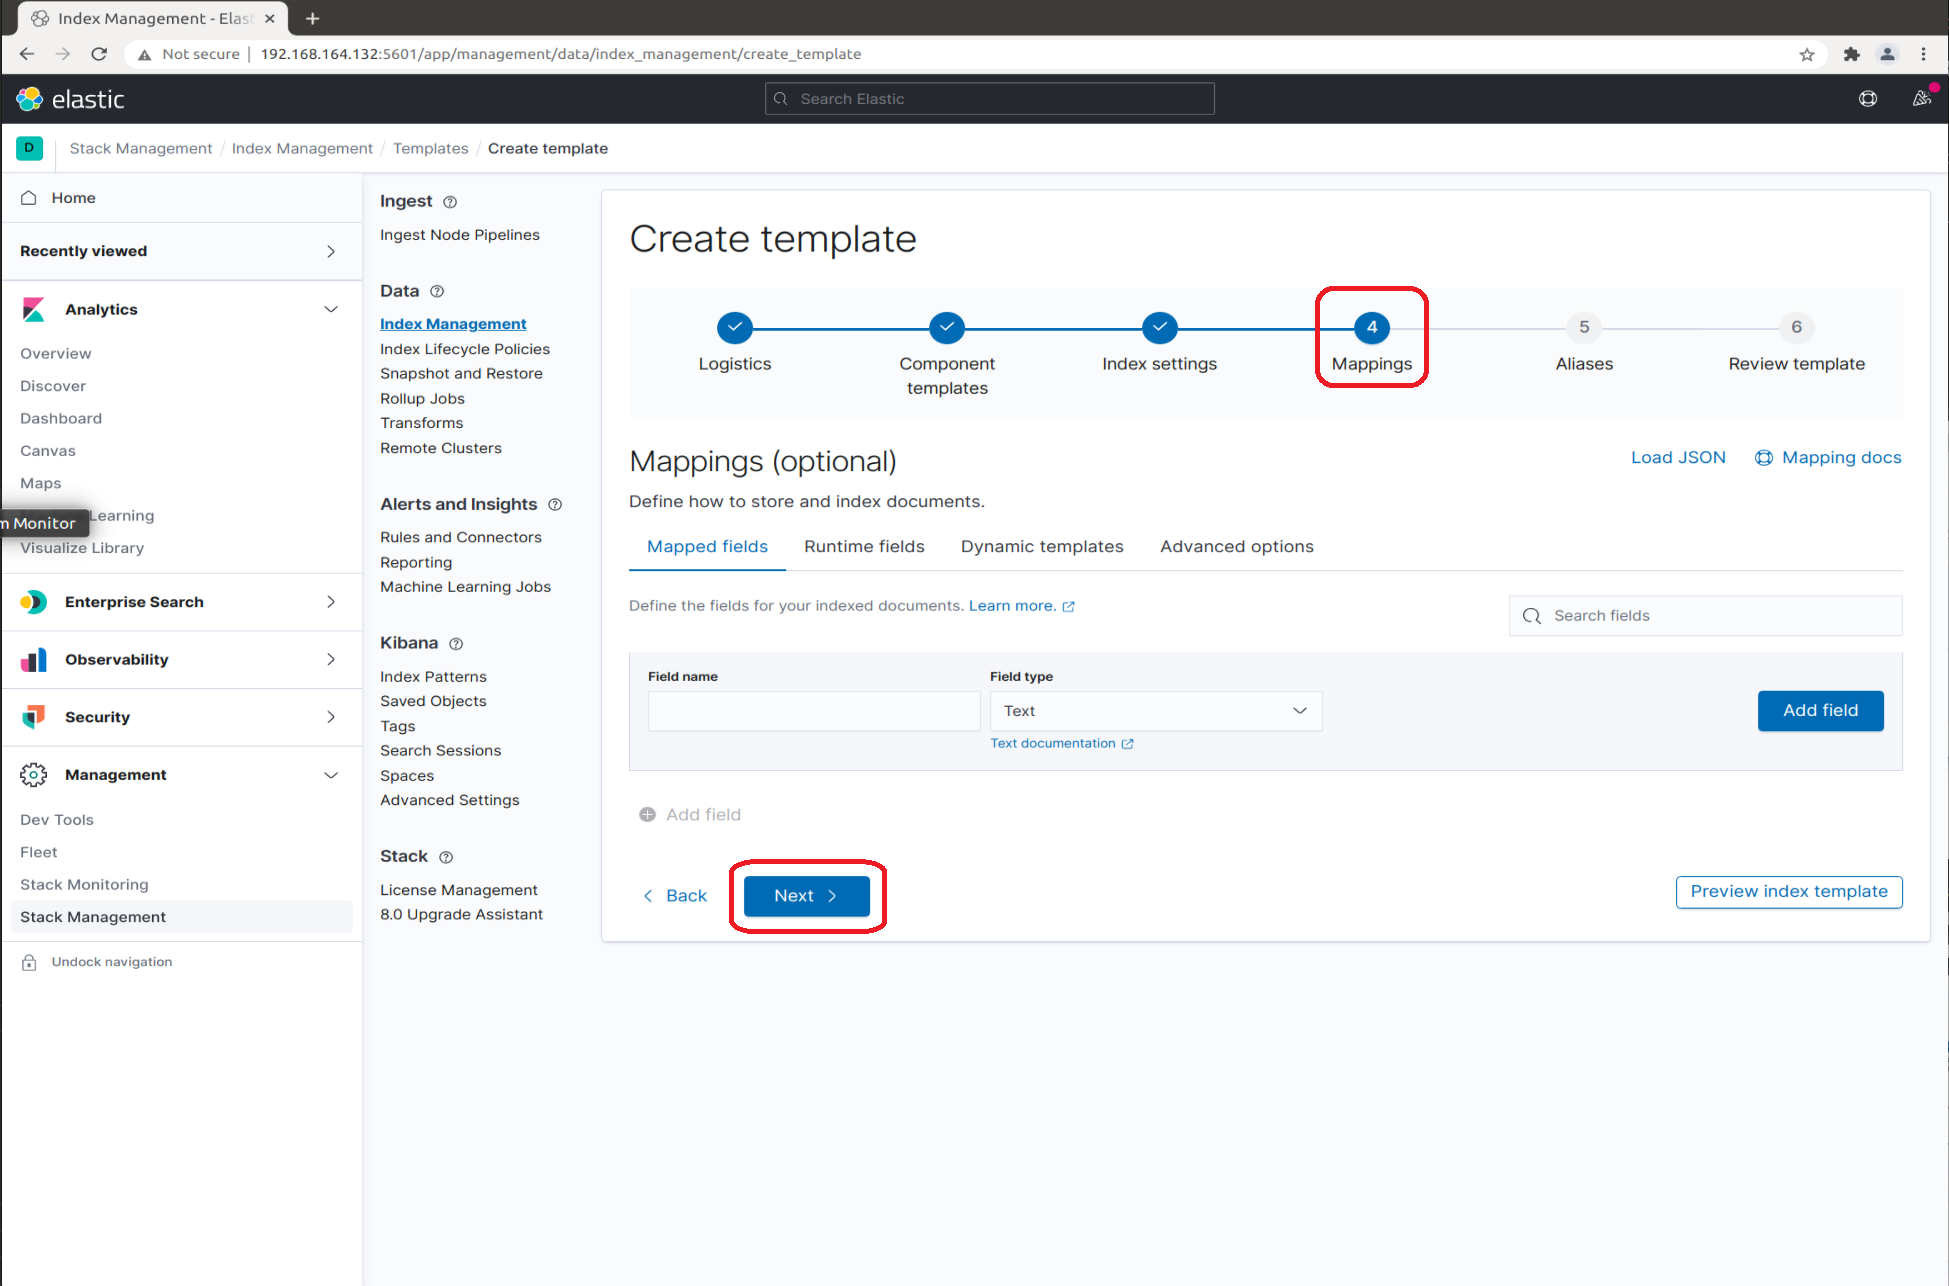
-
-
In the
Aliasestab, nothing has to be specified: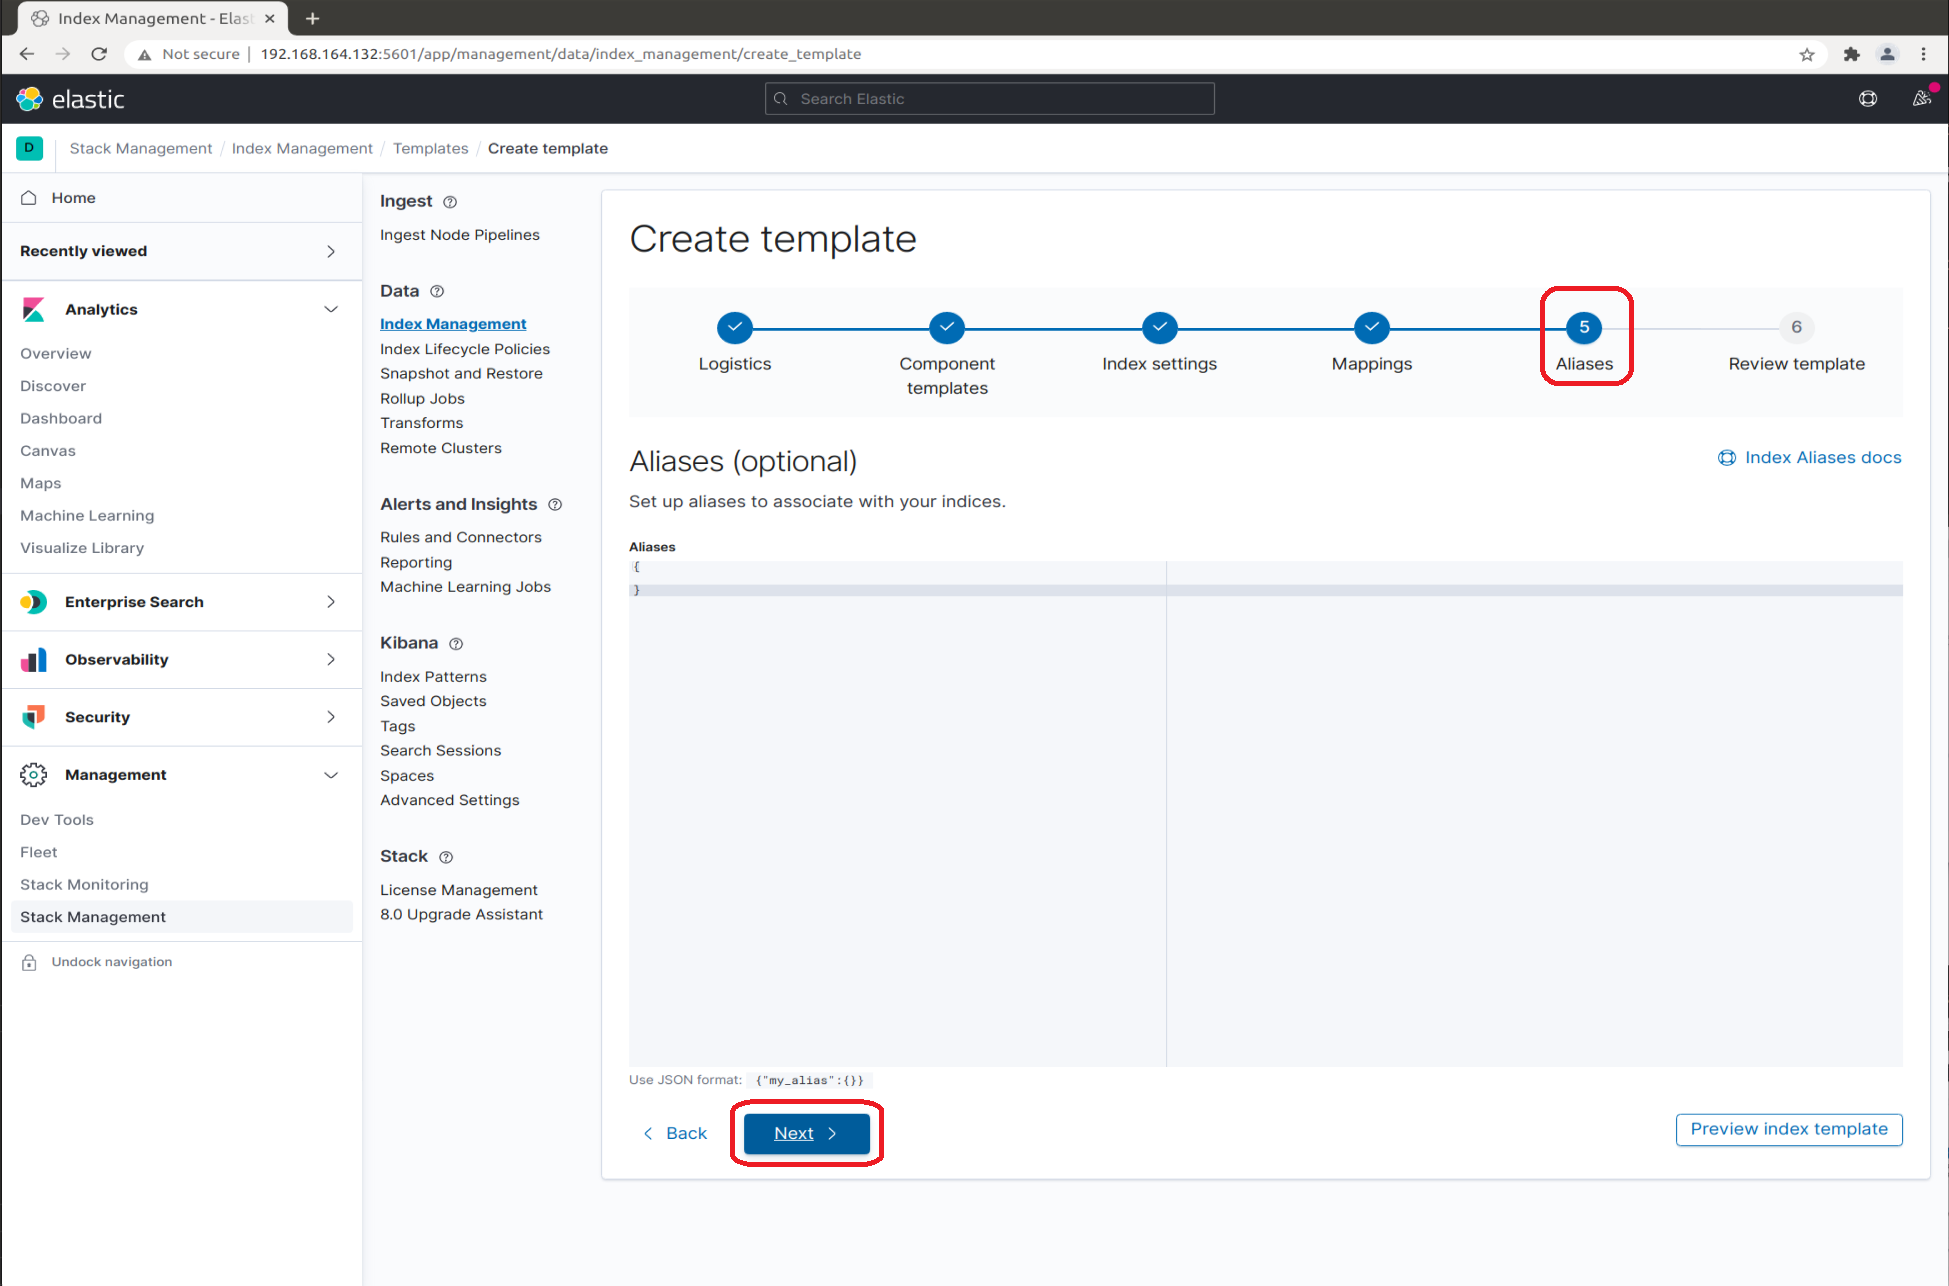
-
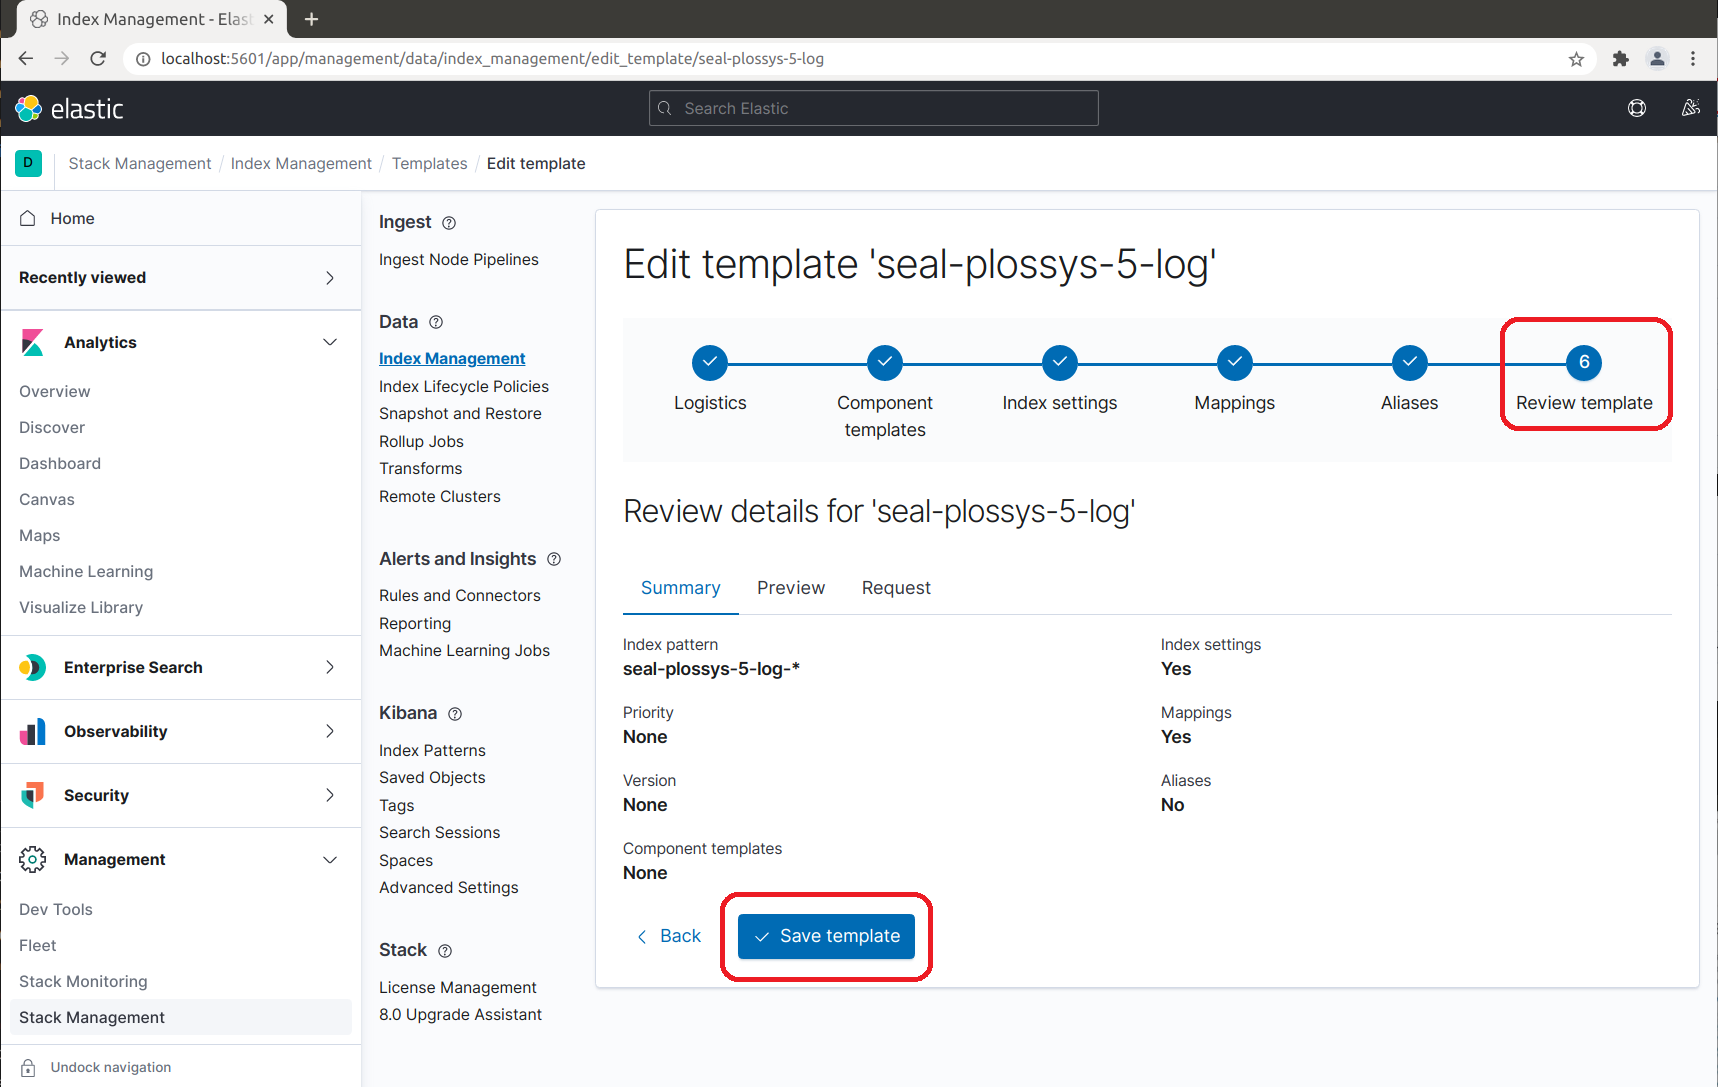
In the
Review templatetab, clickCreate template.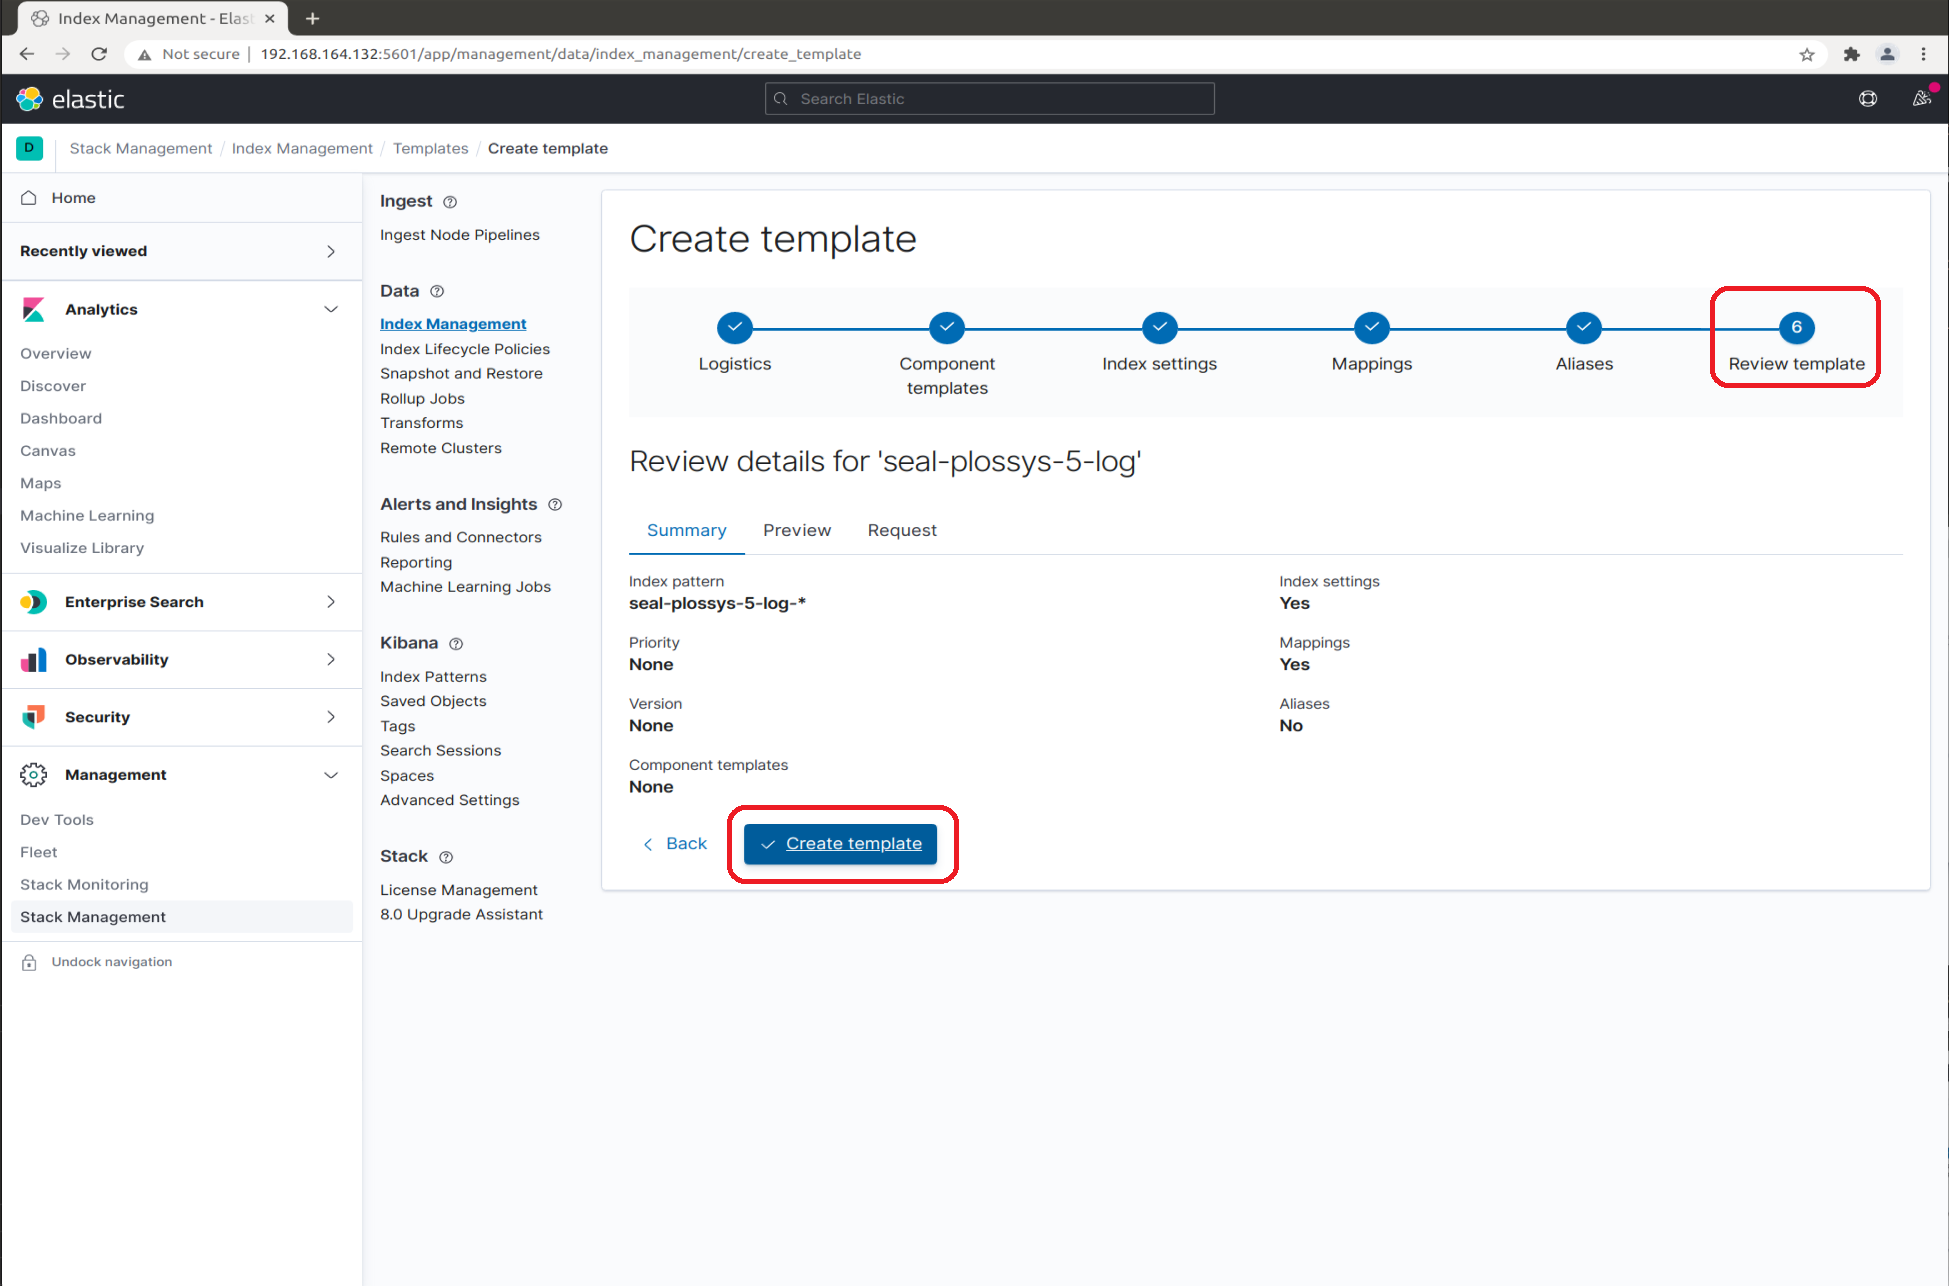
-
-
Create the write aliases for the
seal-plossys-5-logindex. Repeat the steps forseal-plossys-5-statistics,seal-plossys-5-auditandseal-easyprima-auditcorrespondingly if desired:-
In the
Consoletab, enter the following code for theseal-plossys-5-logindex into the left column. Adjust the code for the other index templates correspondingly. Afterwards, click the arrow button:PUT seal-plossys-5-log-000001 { "aliases": { "seal-plossys-5-log": { "is_write_index": true } } }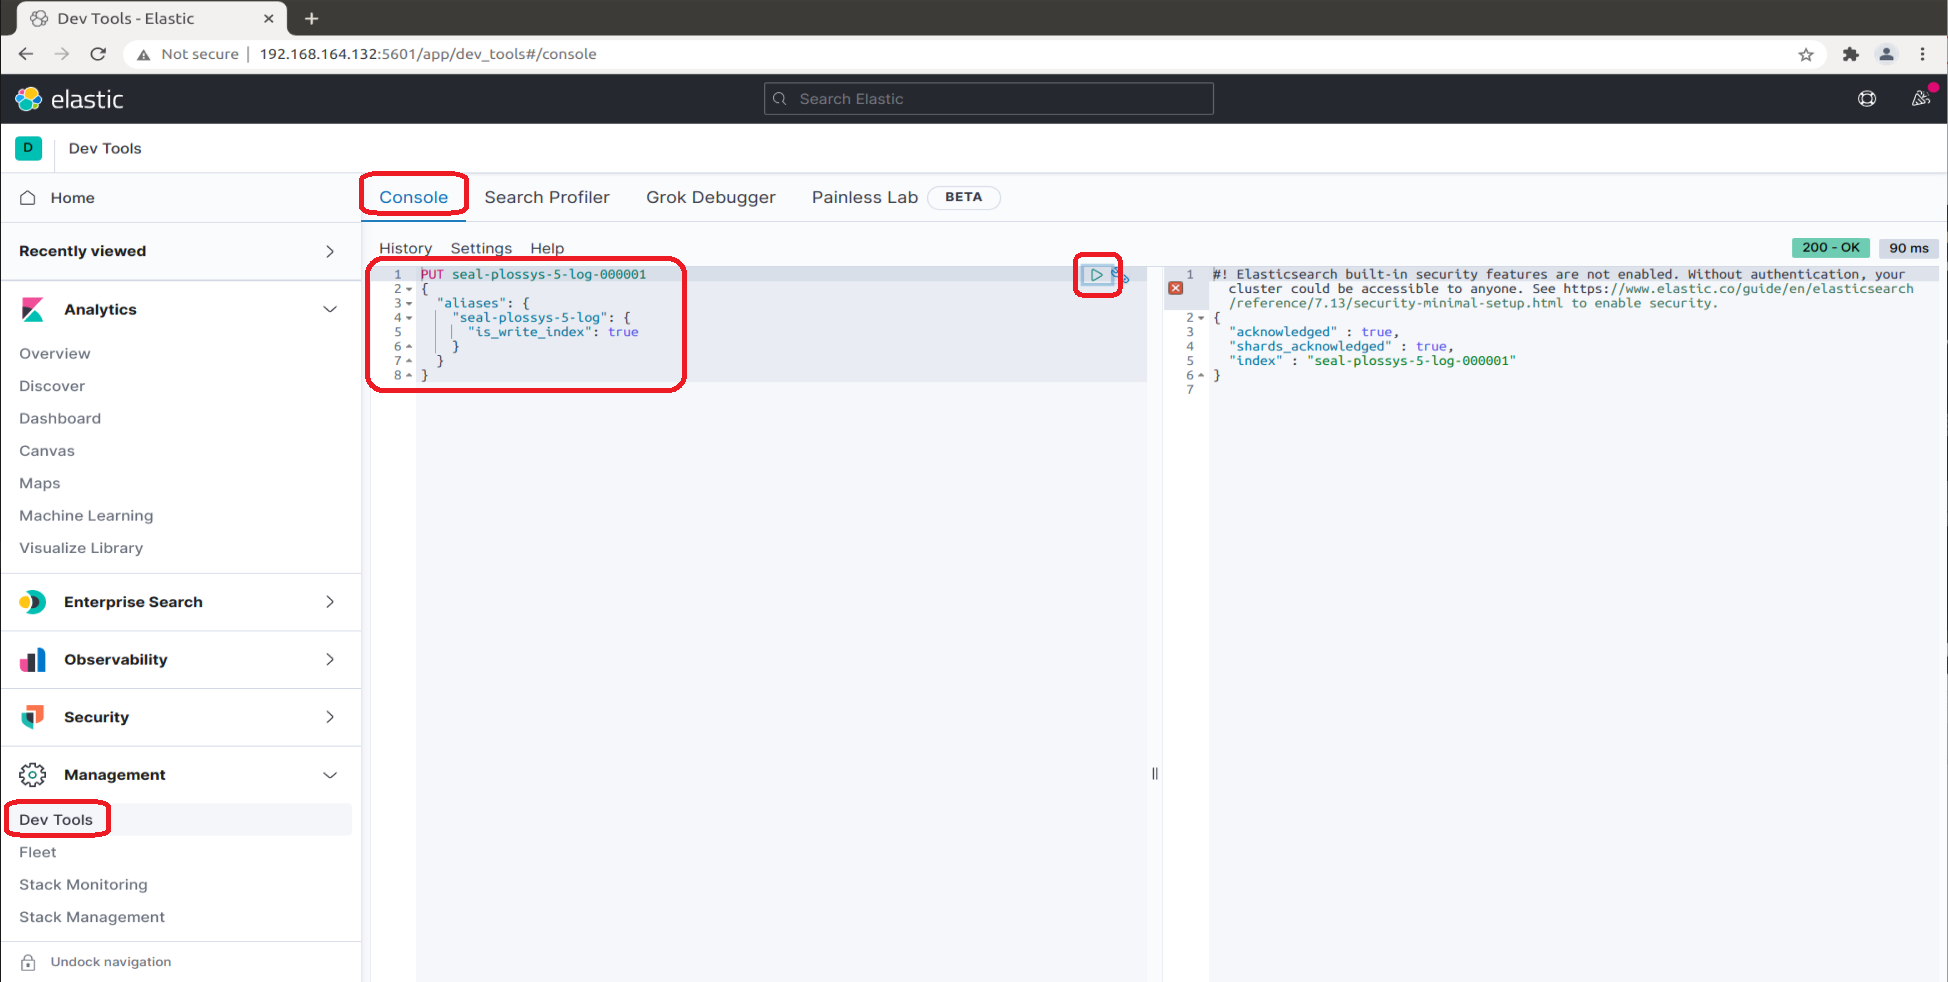
-
-
Check the list of the indices. The
Index Managementlist now contains the indices you have configured so far: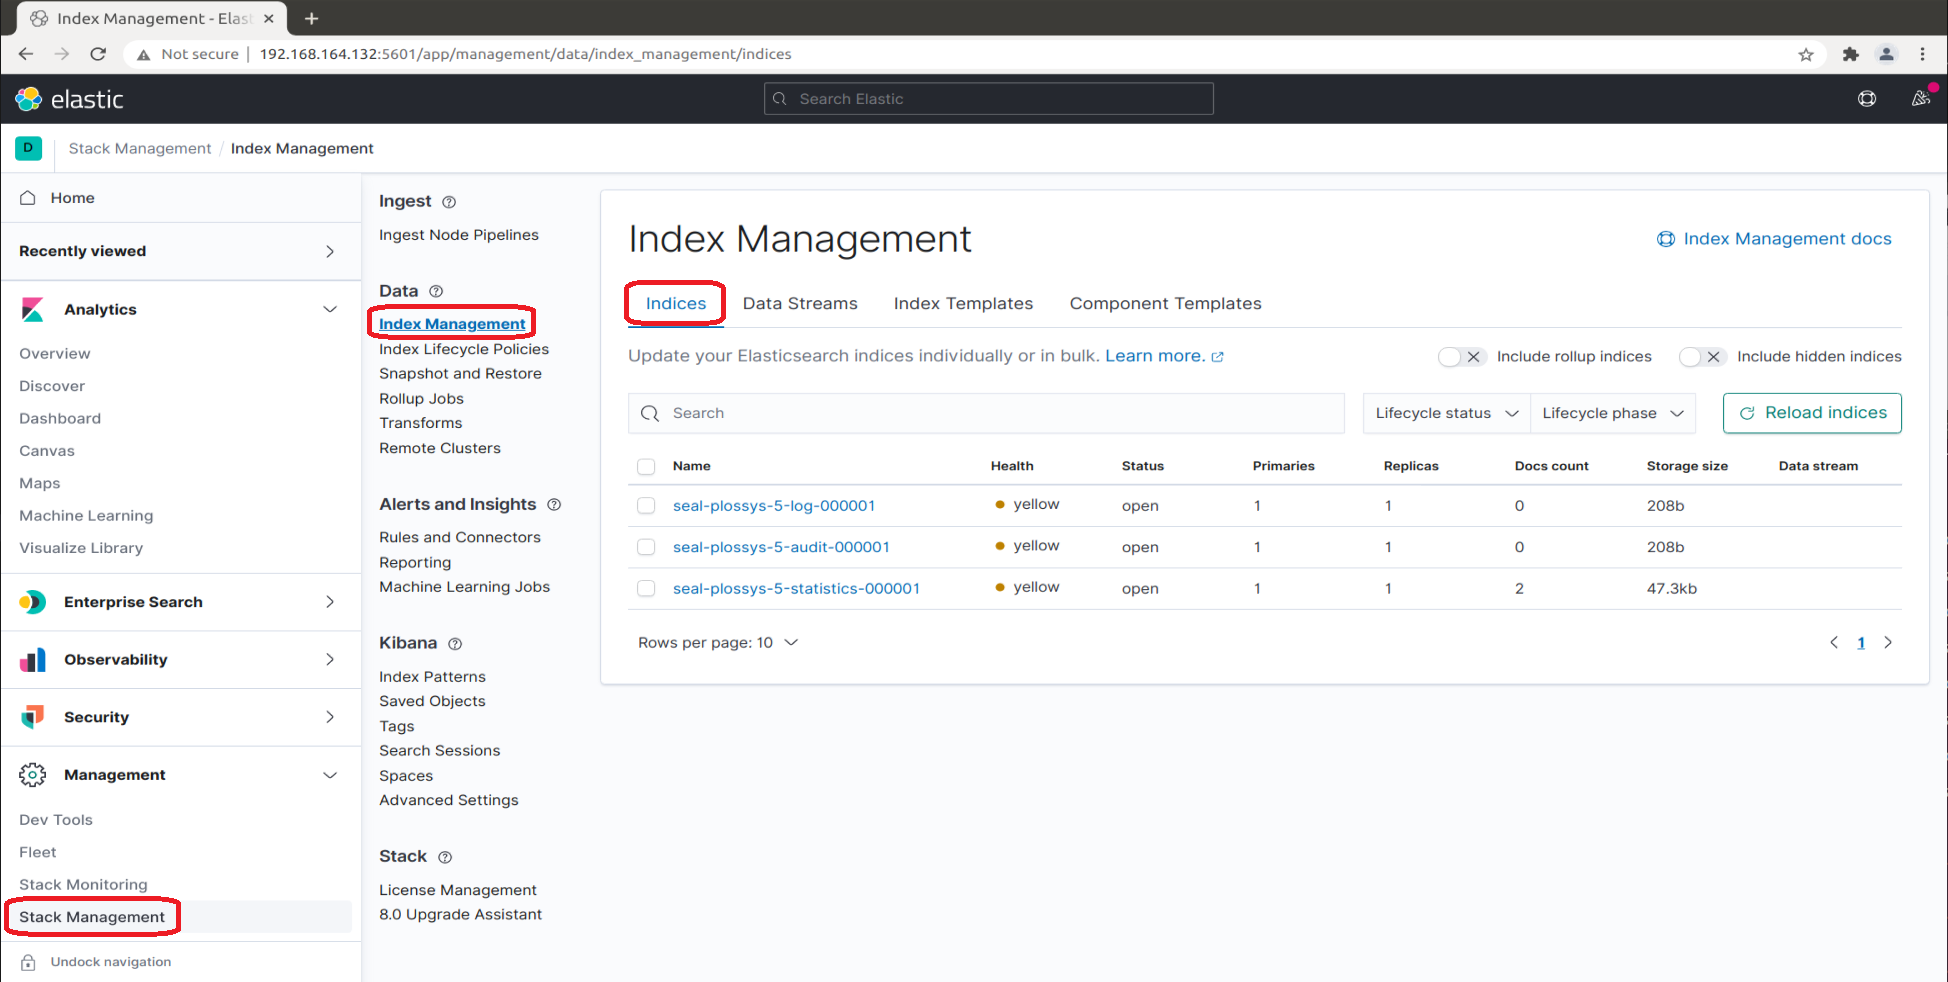
-
Start the
seal-filebeatservices on all PLOSSYS 5 servers (if already installed):plossys service start seal-filebeat
Create the Index Pattern for the Audit Indices
For the seal-plossys-5-audit index, you have to create an index pattern. Repeat the steps for seal-easyprima-audit correspondingly if desired:
-
Change to
Index Patternsin theKibanasection and clickCreate index pattern.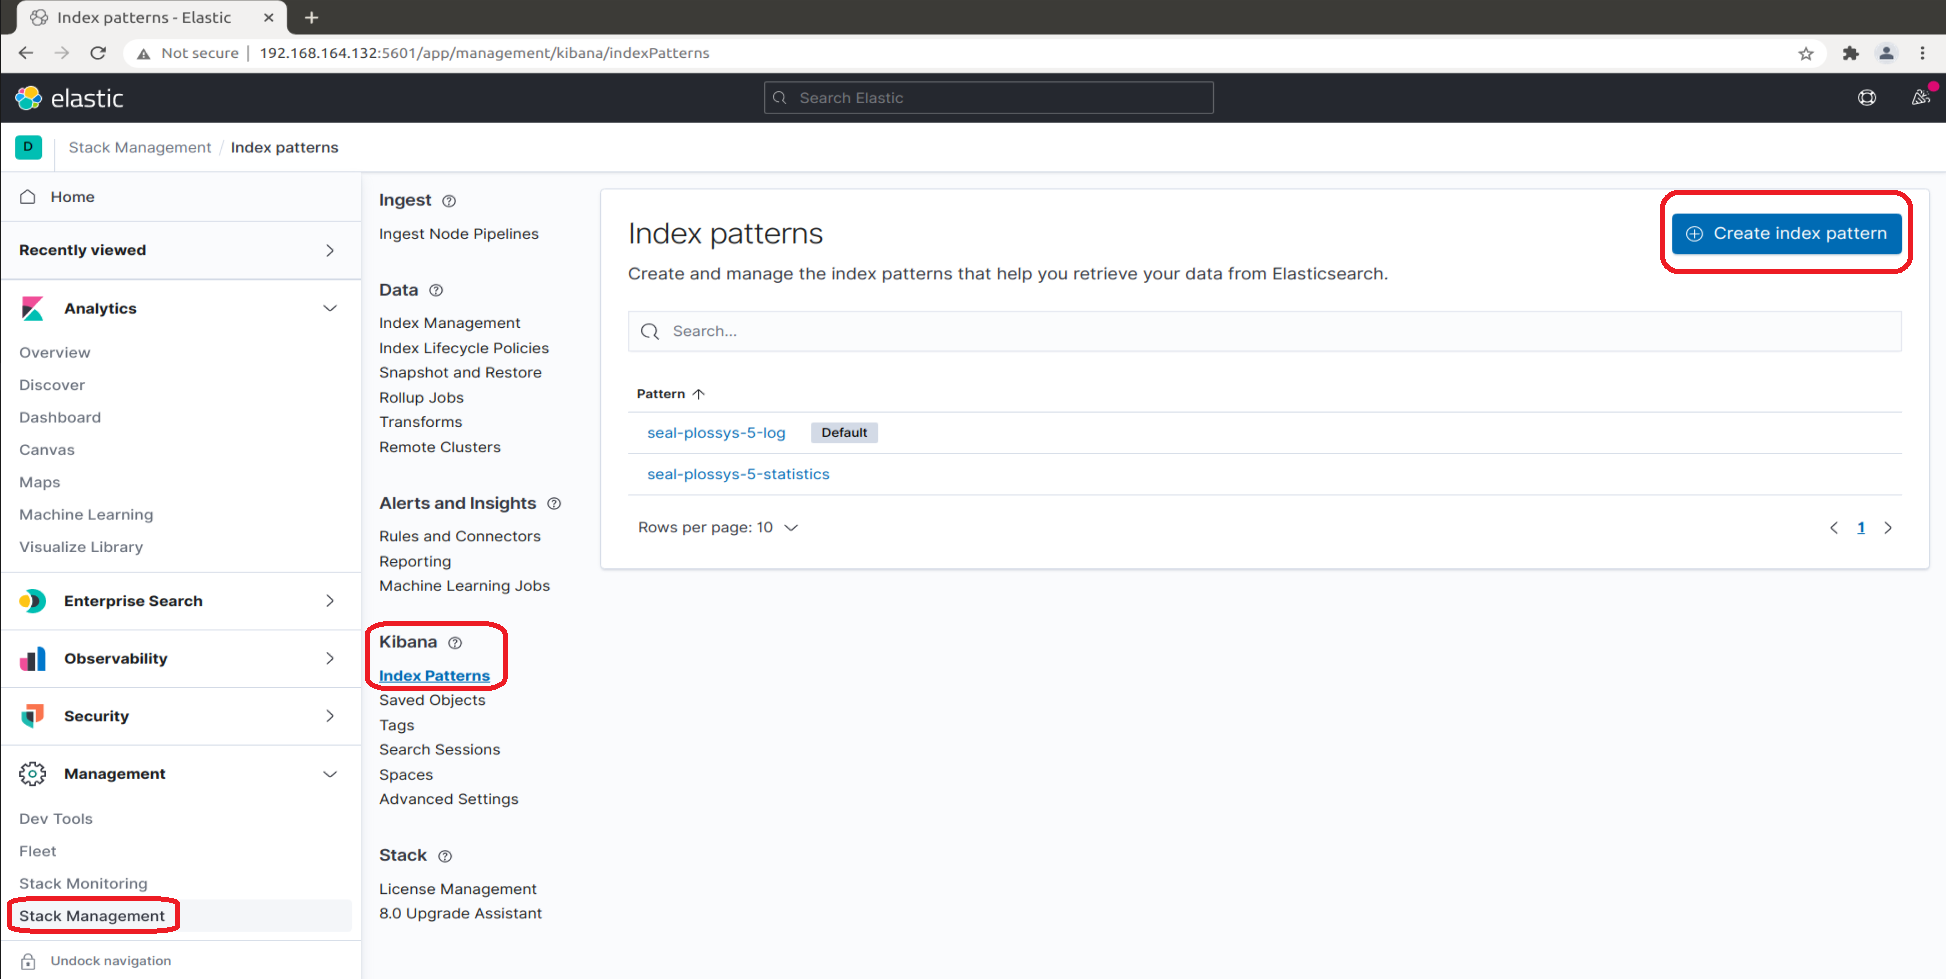
-
While typing
seal-plossys-5-auditinIndex pattern name, the list below shrinks to the fitting indices: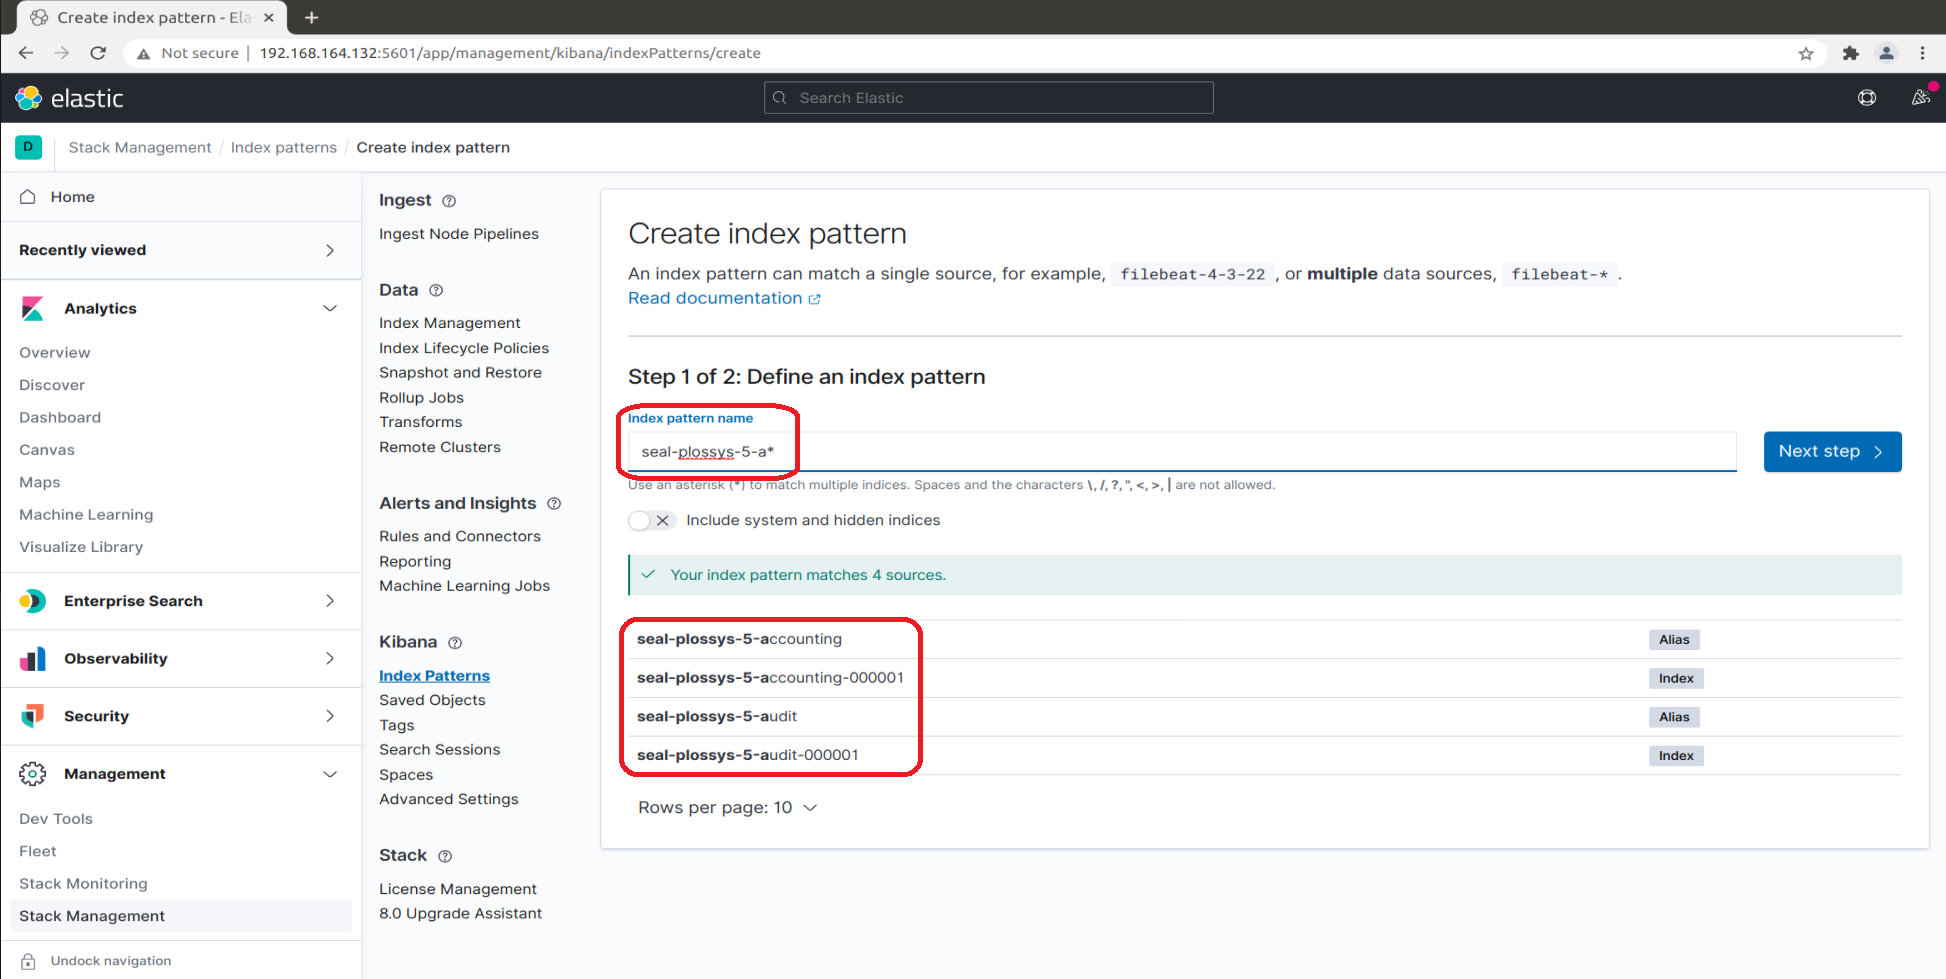
-
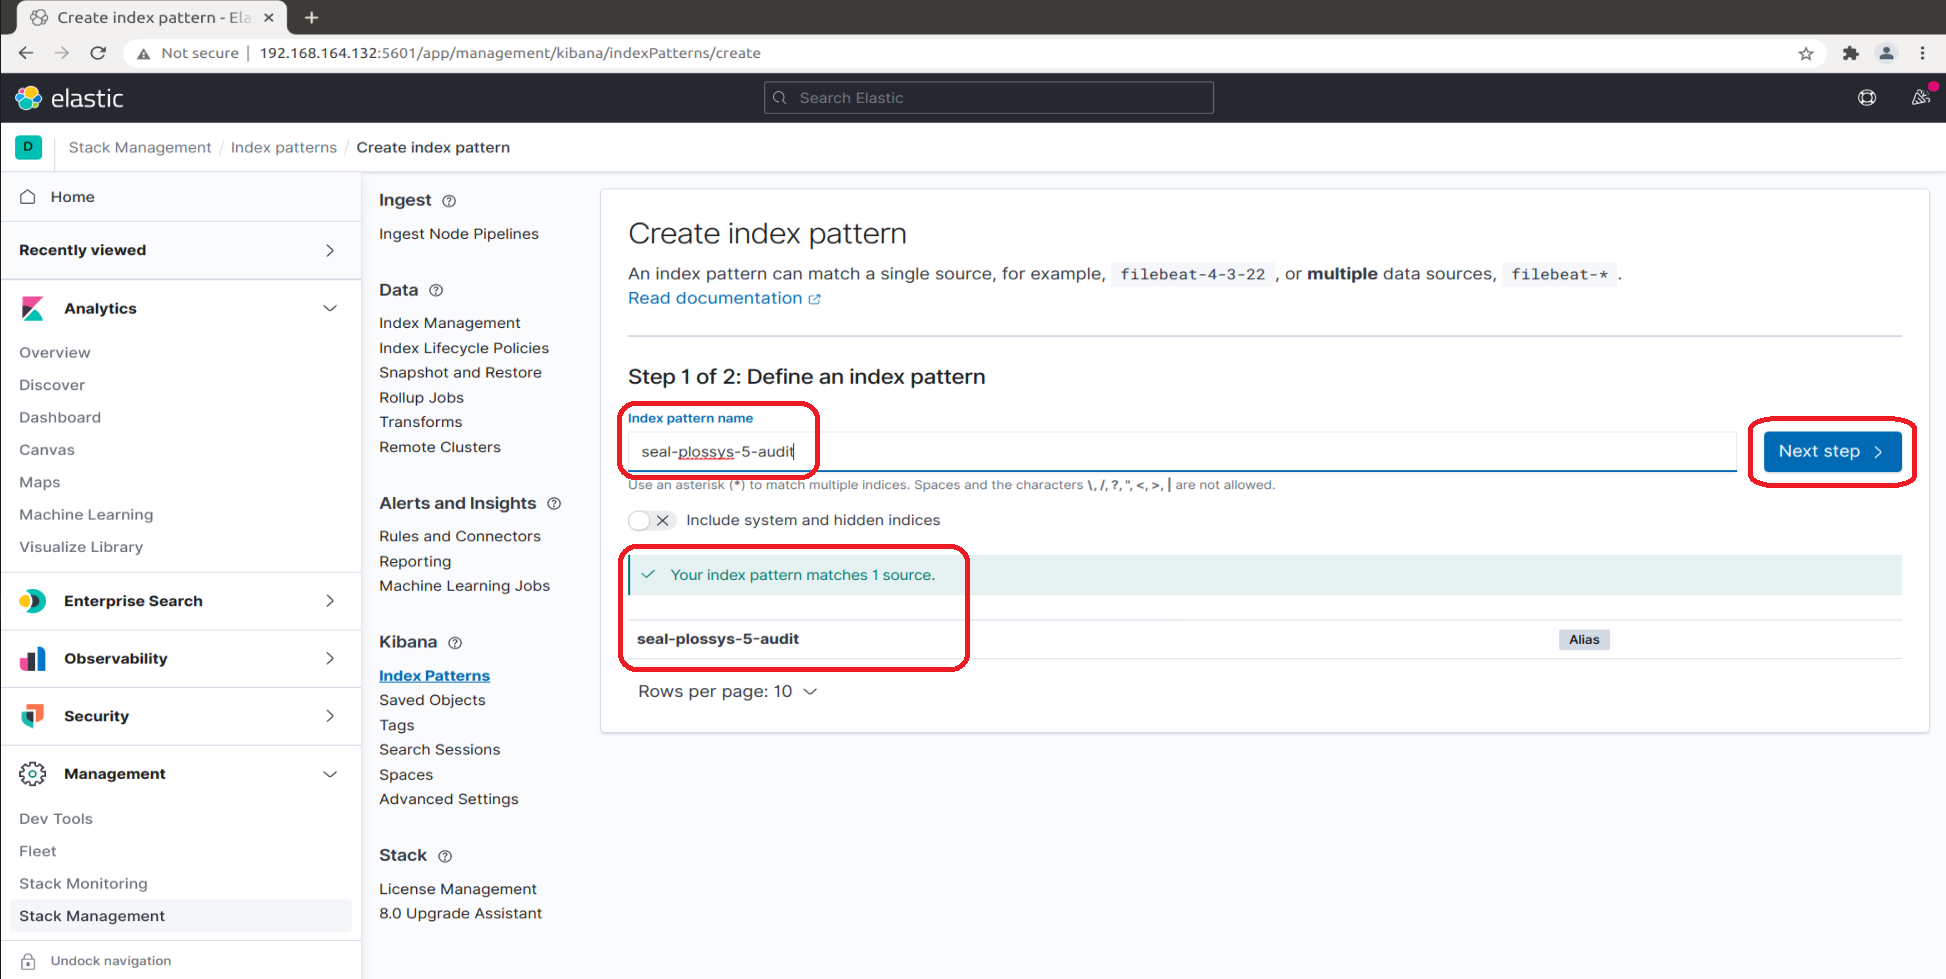
Proceed to the next step:
-
Select
@timestampfrom the list of available fields for refreshing the data and clickCreate index pattern: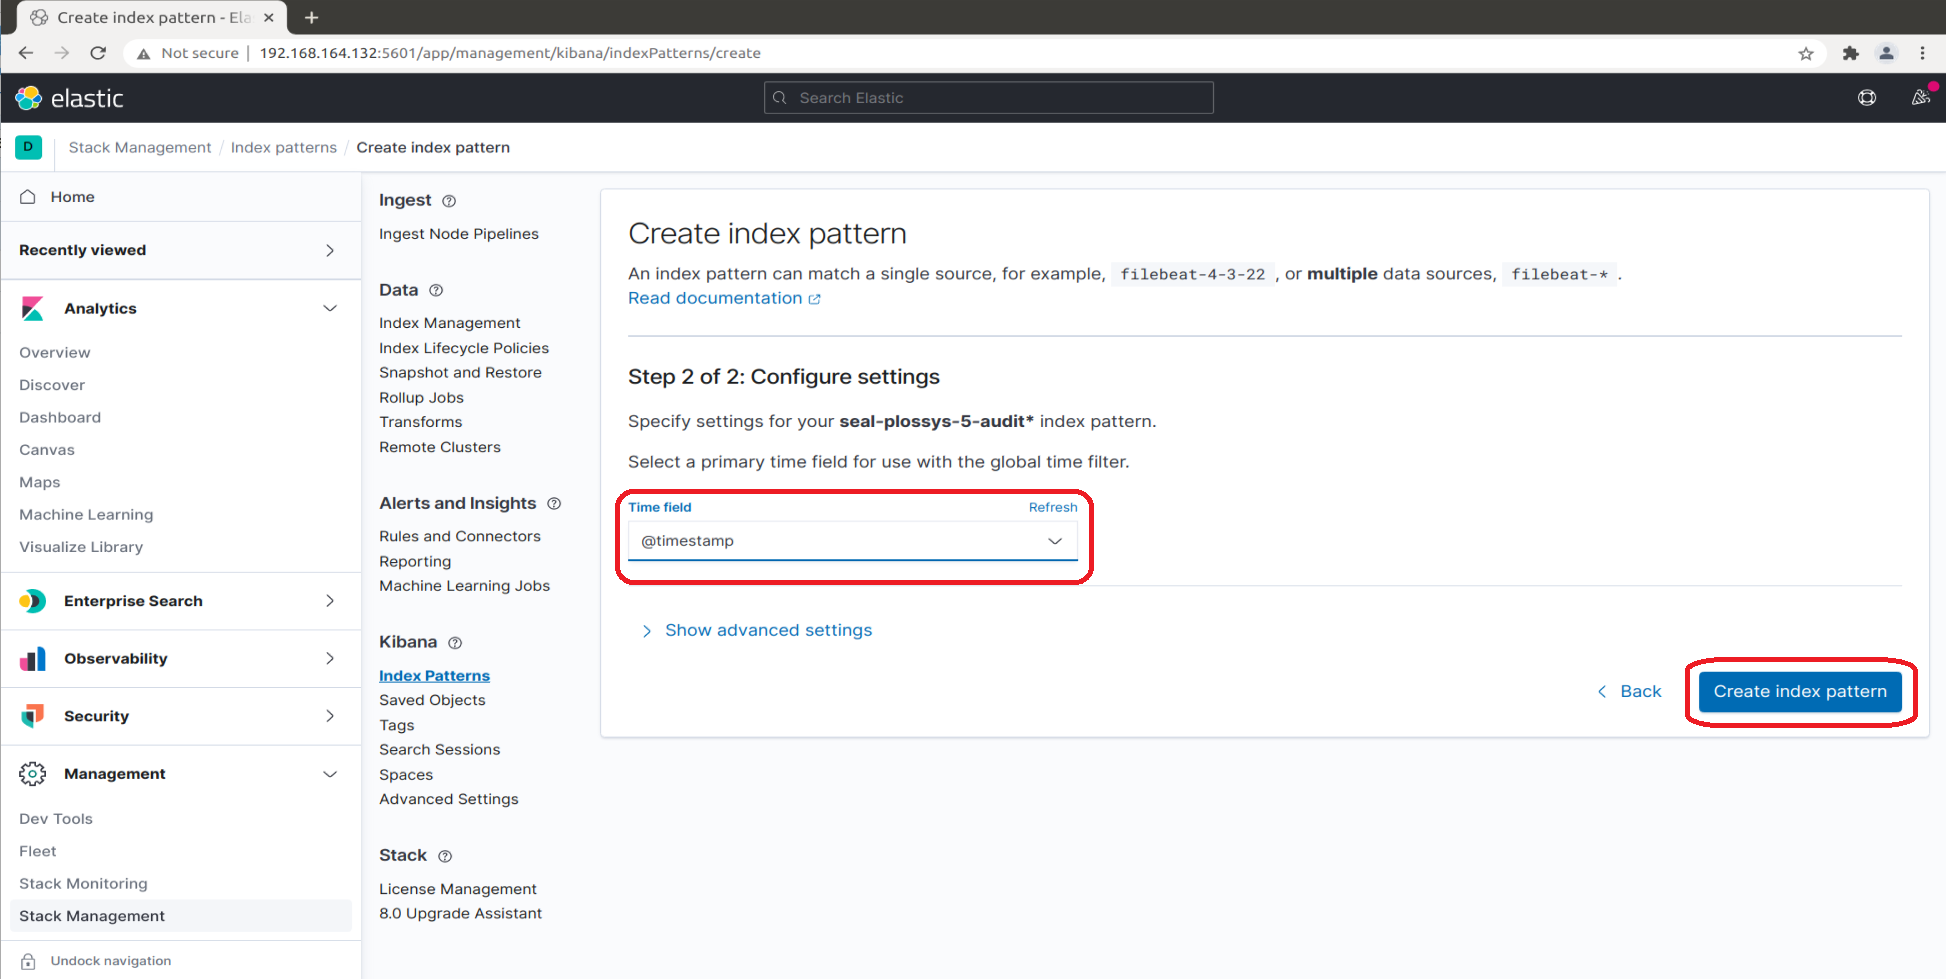
Optionally, click on
Show advanced settings, enterseal-plossys-5-auditasCustom index pattern IDand clickCreate index pattern: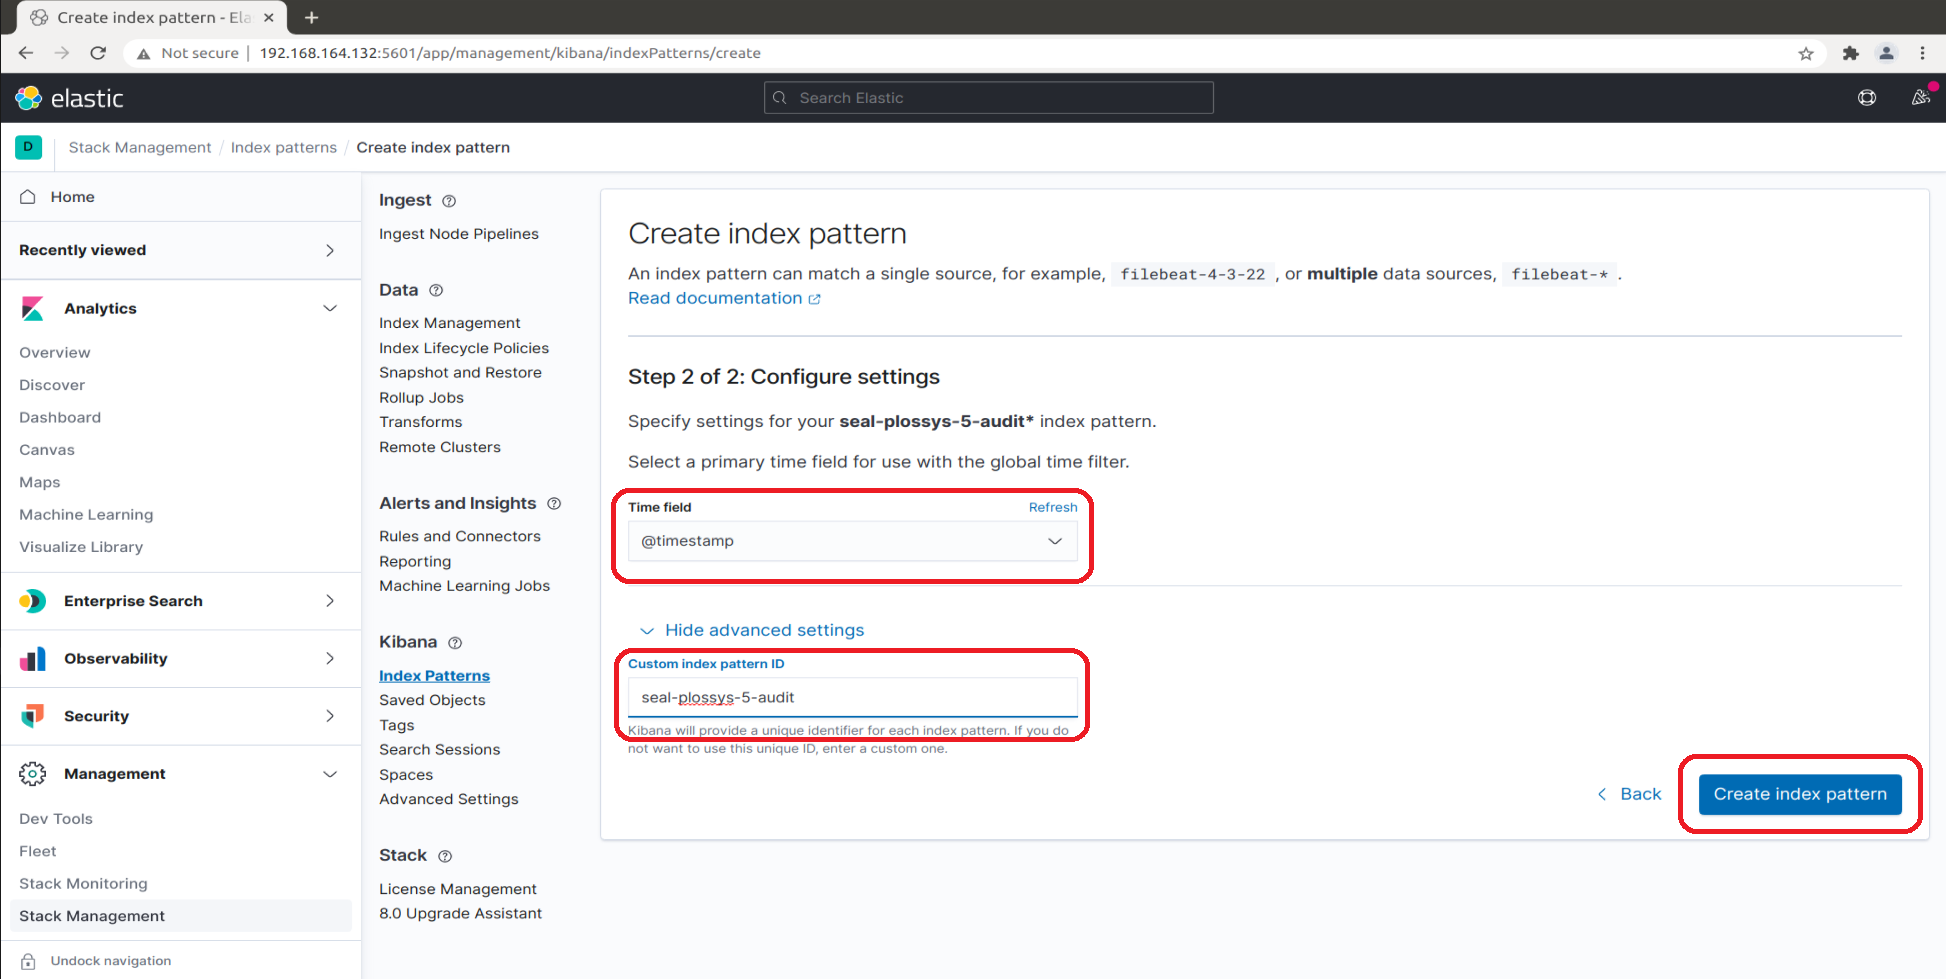
-
In the overview, you can select the
seal-plossys-5-auditindex pattern now: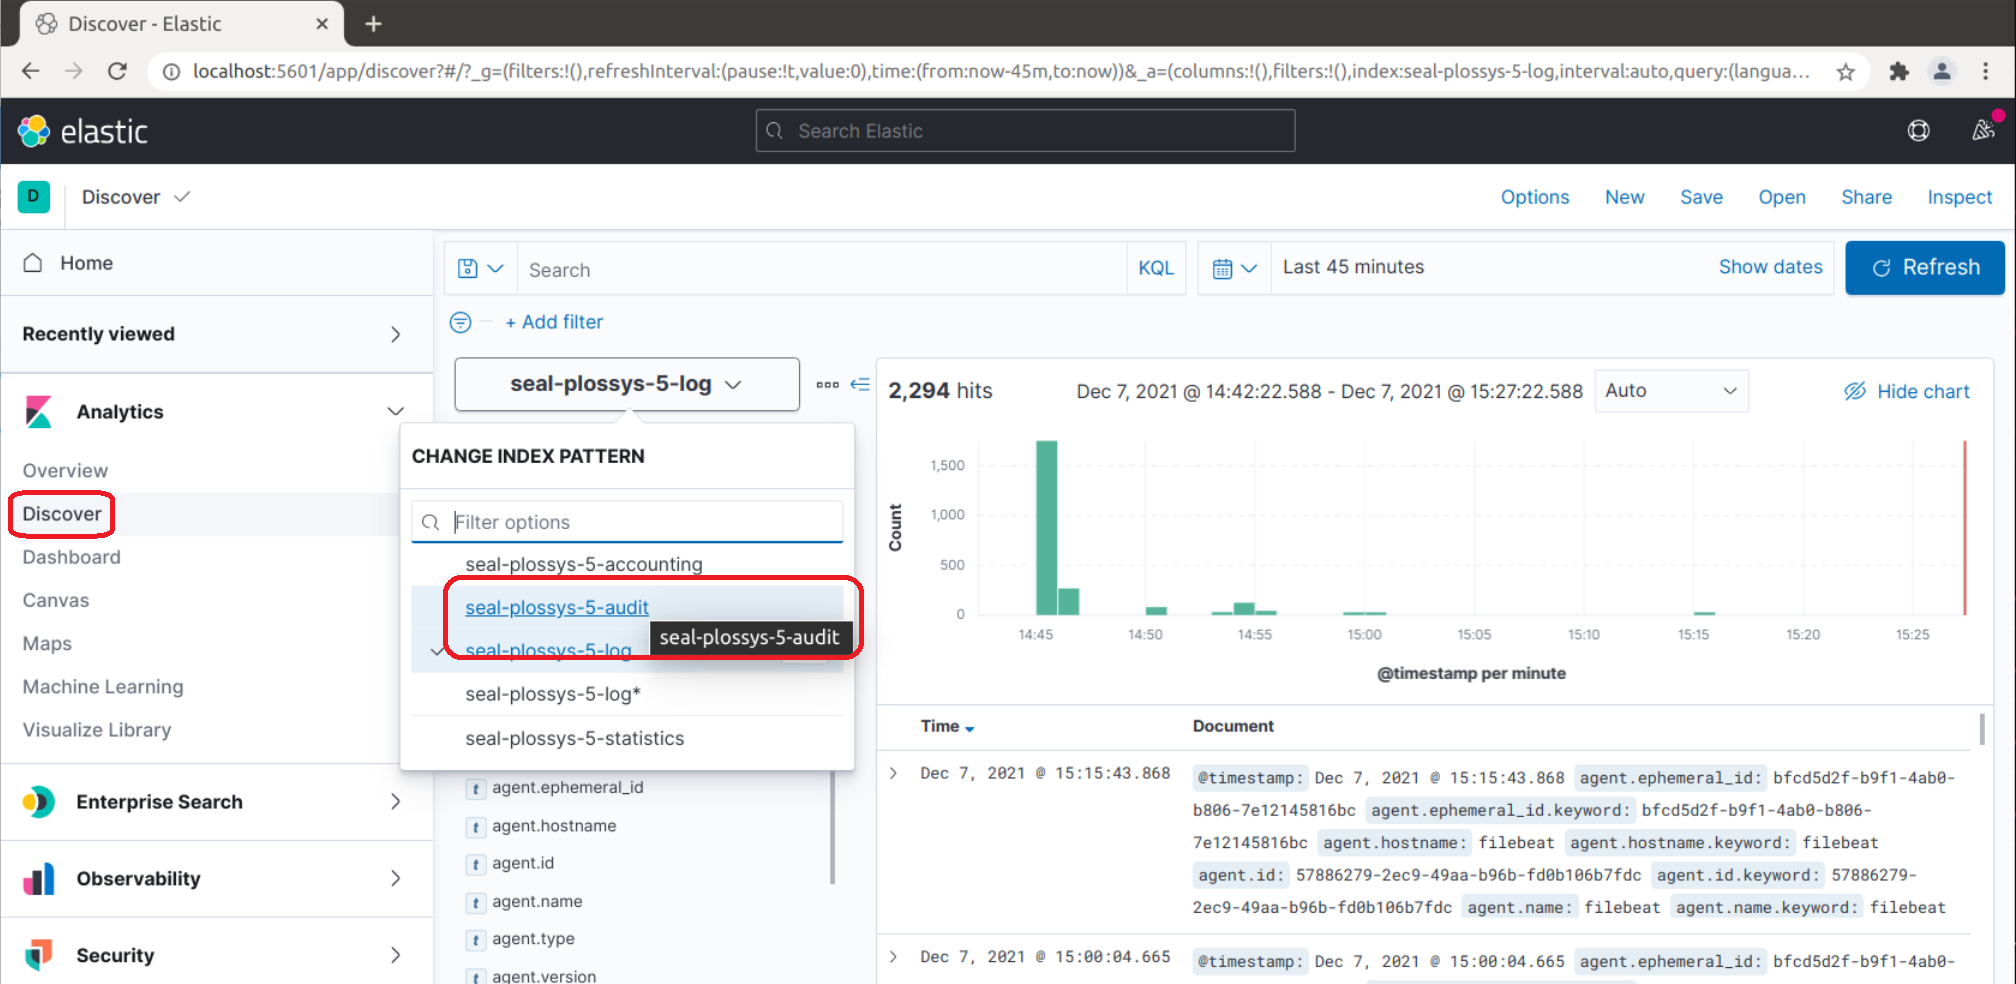
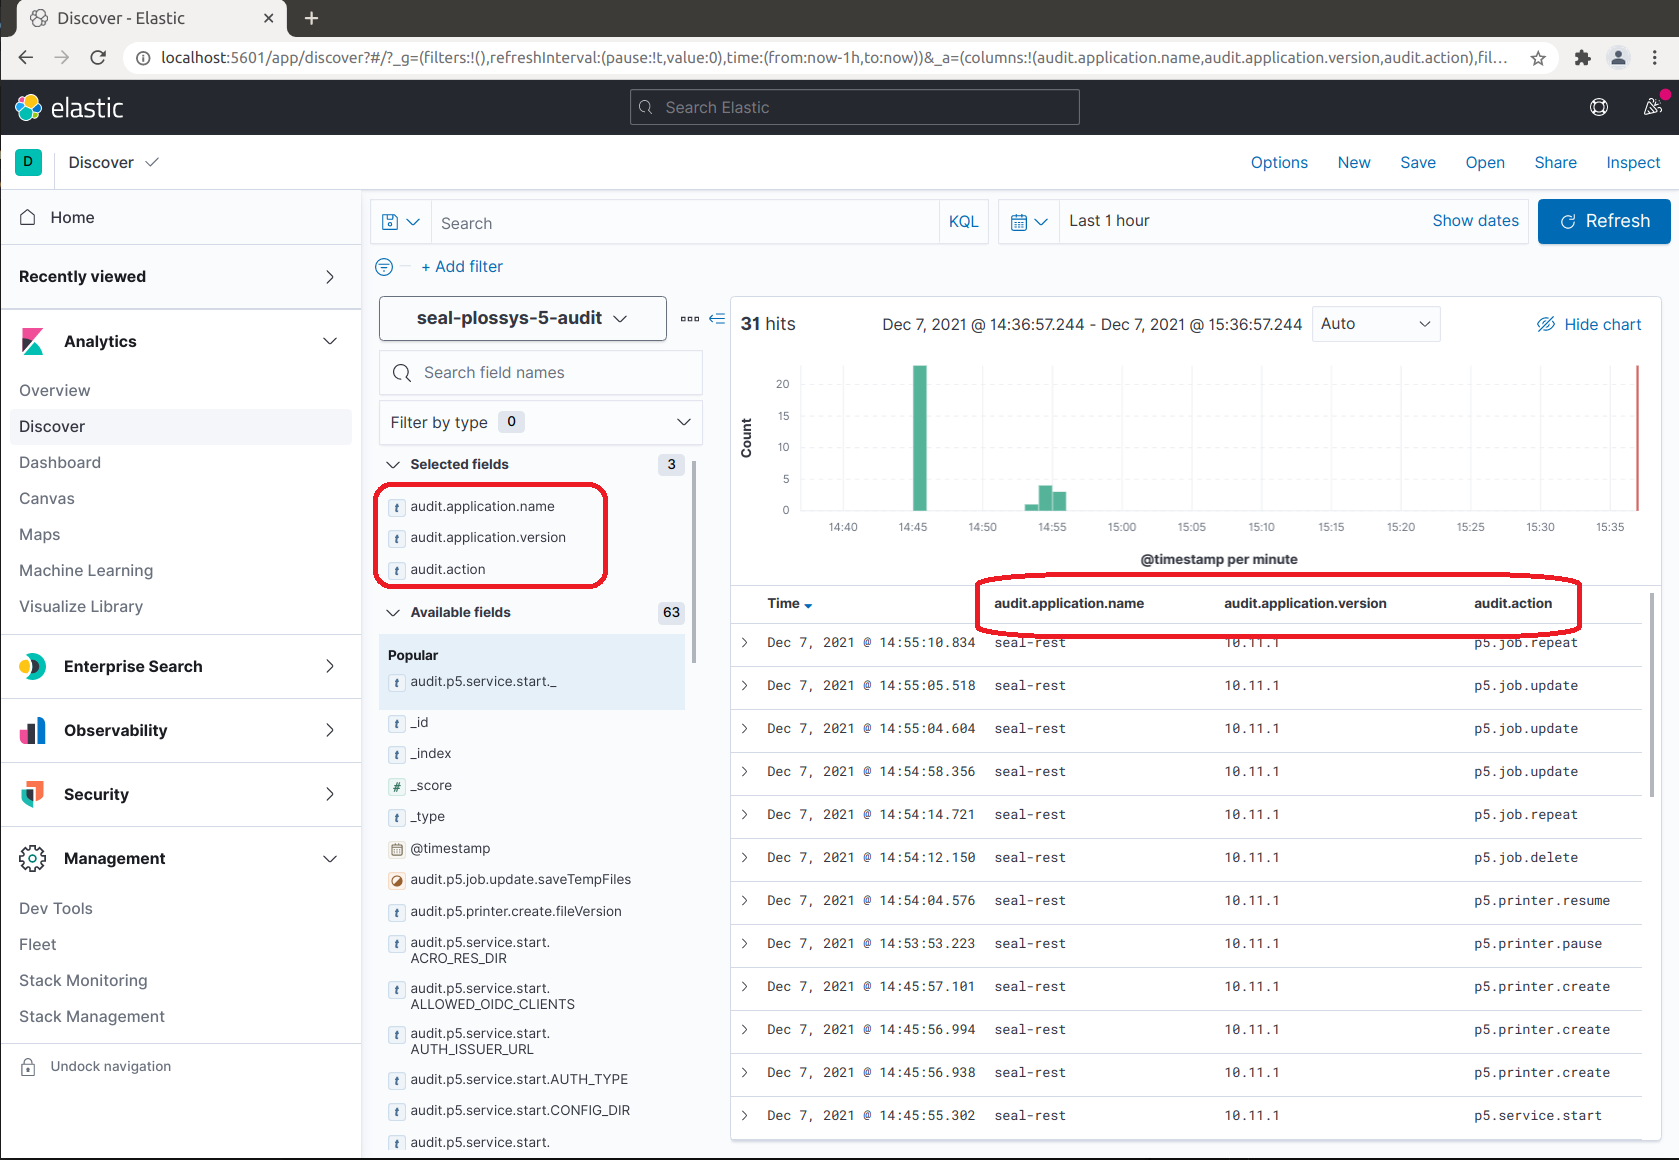
-
The audit data is listed and you can configure the view:
Update a Dashboard for Kibana
Normally, you run the load-config script for creating a new dashboard for Kibana. The dashboard visualizes the data from the Elasticsearch index seal-plossys-5-log.
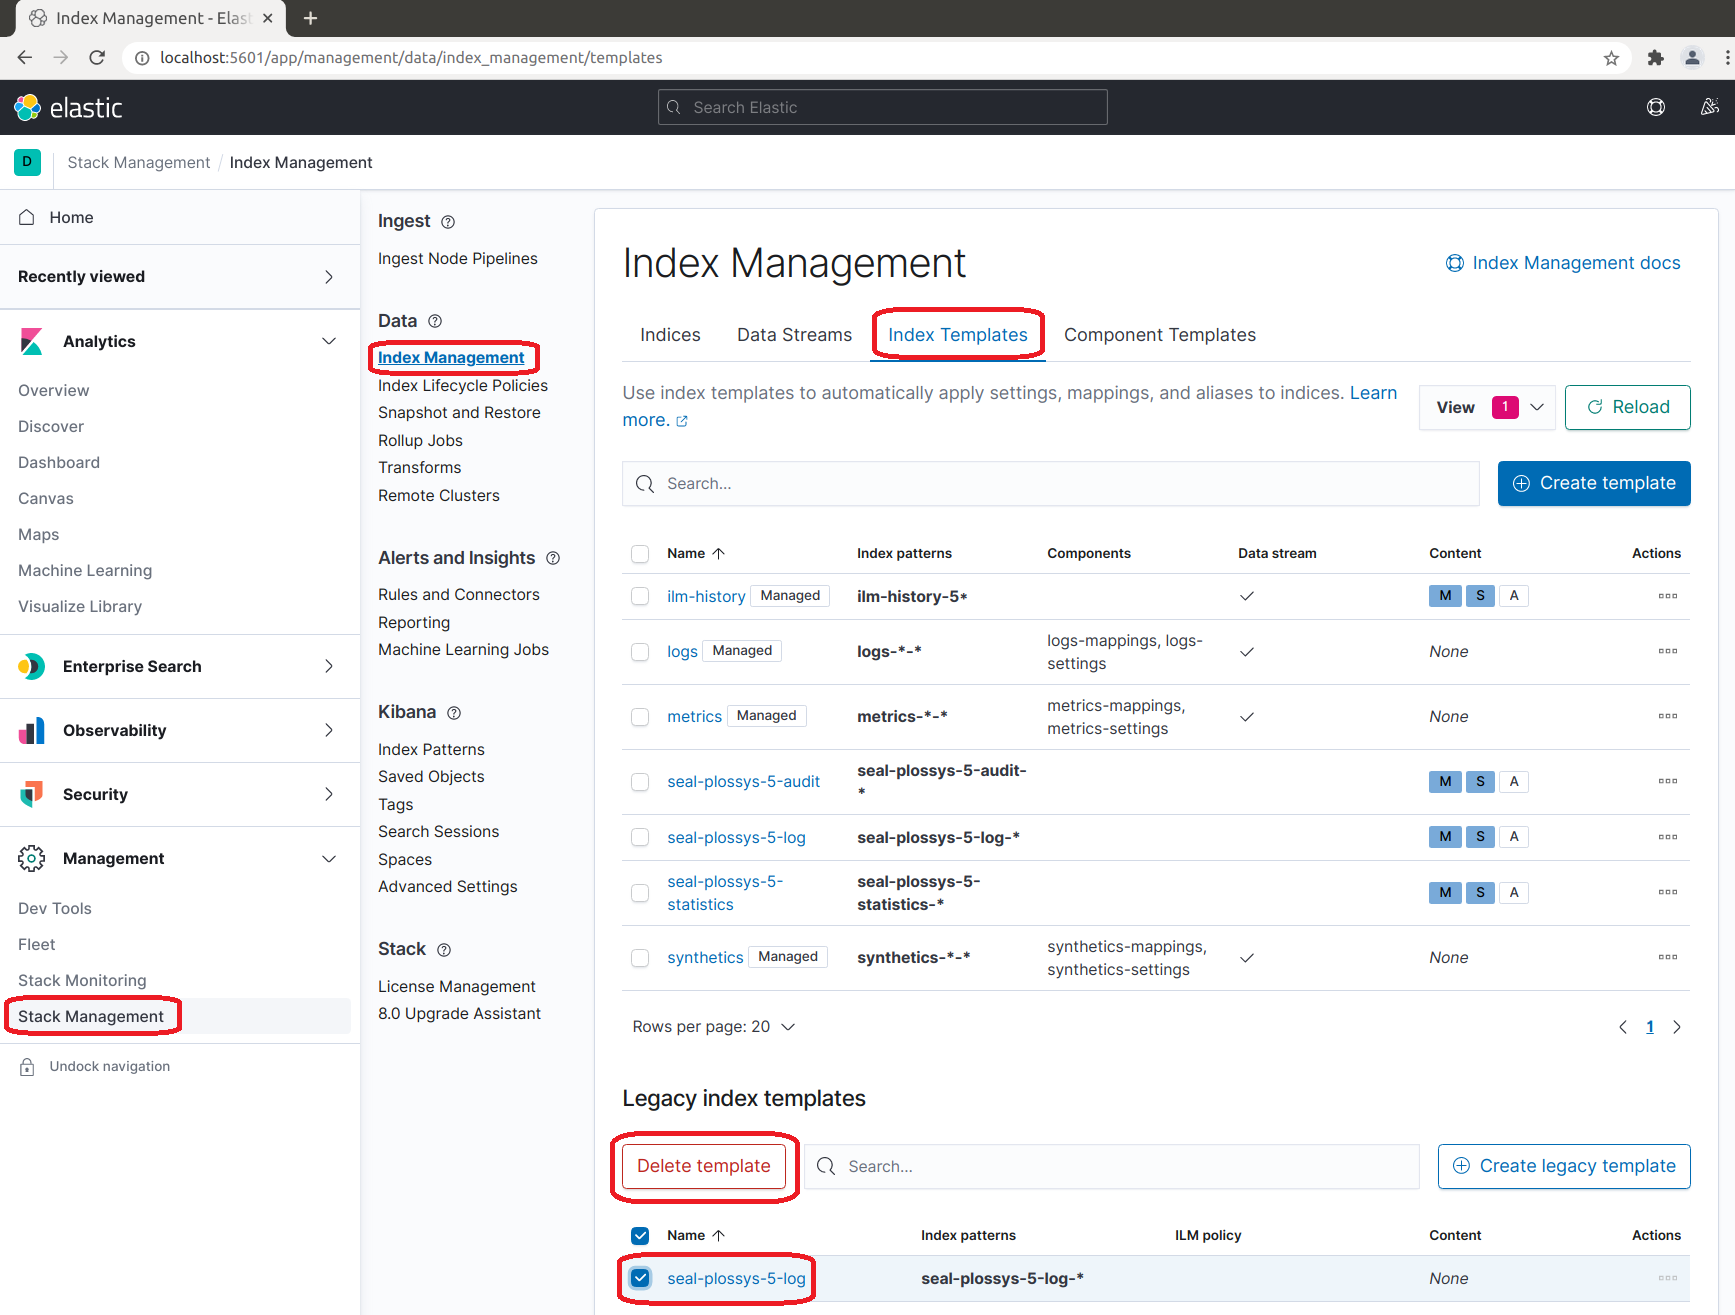
In order to use the dashboard both with the combination of PLOSSYS 5.3.3 and Elastic Stack 7.6.2 and the combination PLOSSYS 5.3.4 and Elastic Stack 7.13.4, you have to modify the already existent seal-plossys-5-log index template or create a new one. The versions differ in the configuration of the Mappings tab, refer to the JSON object listed below.
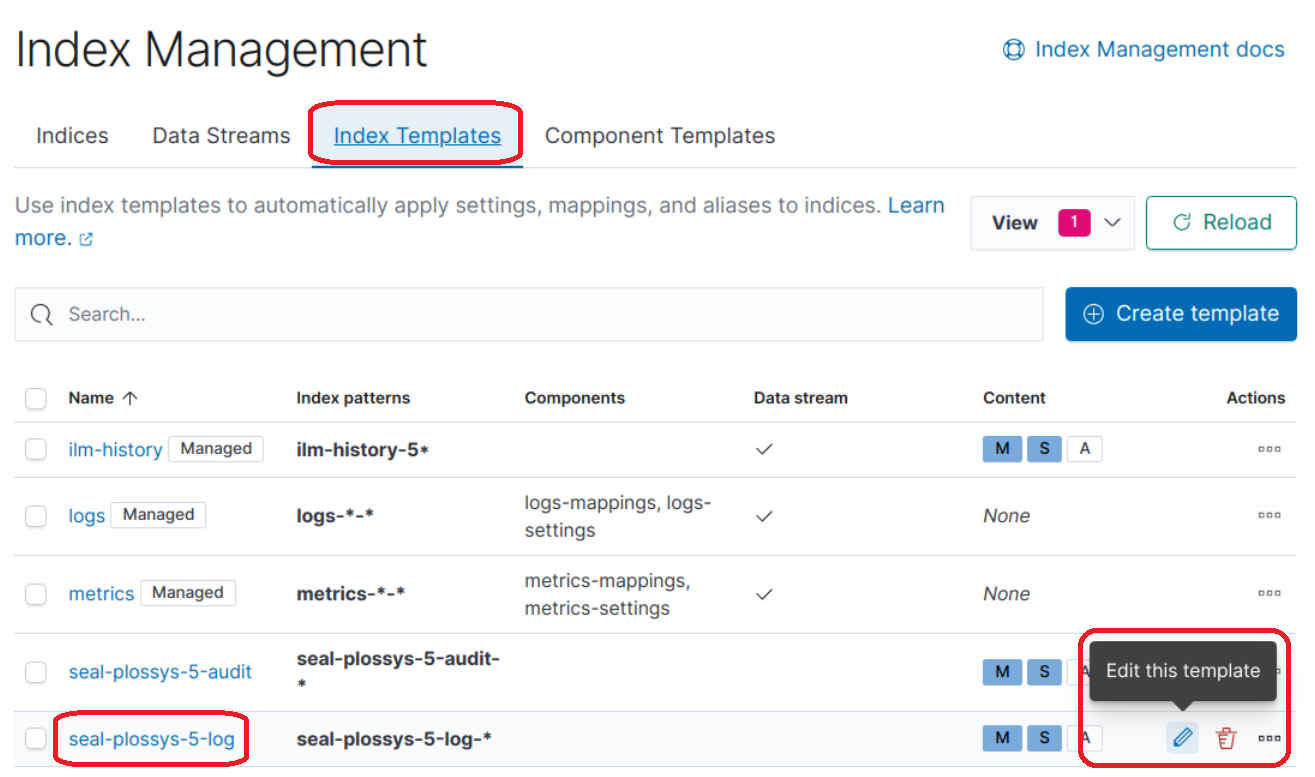
The previous index template can be found via the Kibana user interface in the Legacy index templates section and deleted if desired:
For updating the existent index template for the new dashboard manually, open the Kibana user interface and edit the existent seal-plossys-5-log index template:
In the Mappings tab, click Load JSON and enter the JSON object described in the section above:
{
  "properties": {
    "metadata": {
      "properties": {
        "jobId": {
          "type": "keyword"
        },
        "jobProperties": {
          "type": "object"
        },
        "printer": {
          "type": "keyword"
        },
        "psProperties": {
          "type": "flattened",
          "ignore_above": 8191
        }
      }
    }
  }
}
In the Review template tab, click Save template: